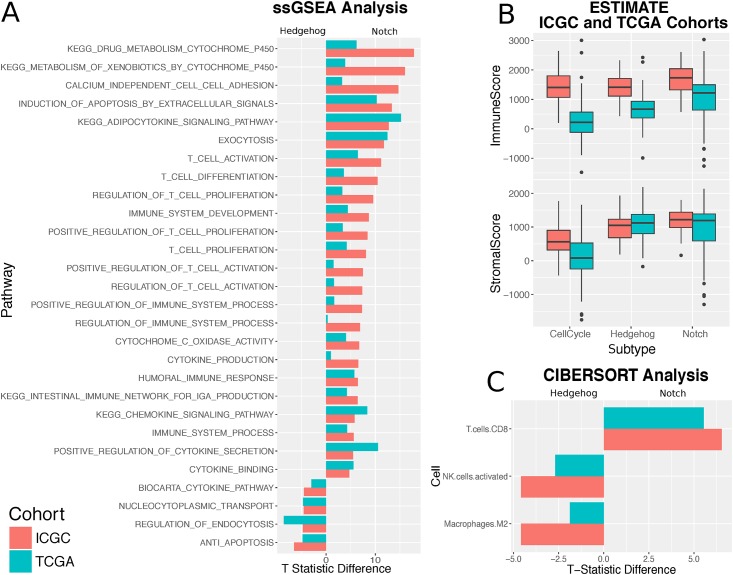
Fig 4. Subtypes show different immune activity.
A. Bar plot showing the Pearson partial correlation t-statistic difference between Hedgehog and Notch for ssGSEA pathway enrichment scores significantly associated with one subtype or the other. B. Boxplots from the ESTIMATE analysis showing the variation in the stromal and immune content between the Hedgehog, Notch, and cell cycle subgroups for both the ICGC and TCGA cohorts. C. Bar plot showing the difference in Pearson partial correlation coefficient difference between Hedgehog and Notch for estimated CIBERSORT leukocyte cell fractions significantly associated with one subtype or the other. A negative difference highlights strong association with Hedgehog, whereas a positive value indicates a strong association with Notch.

