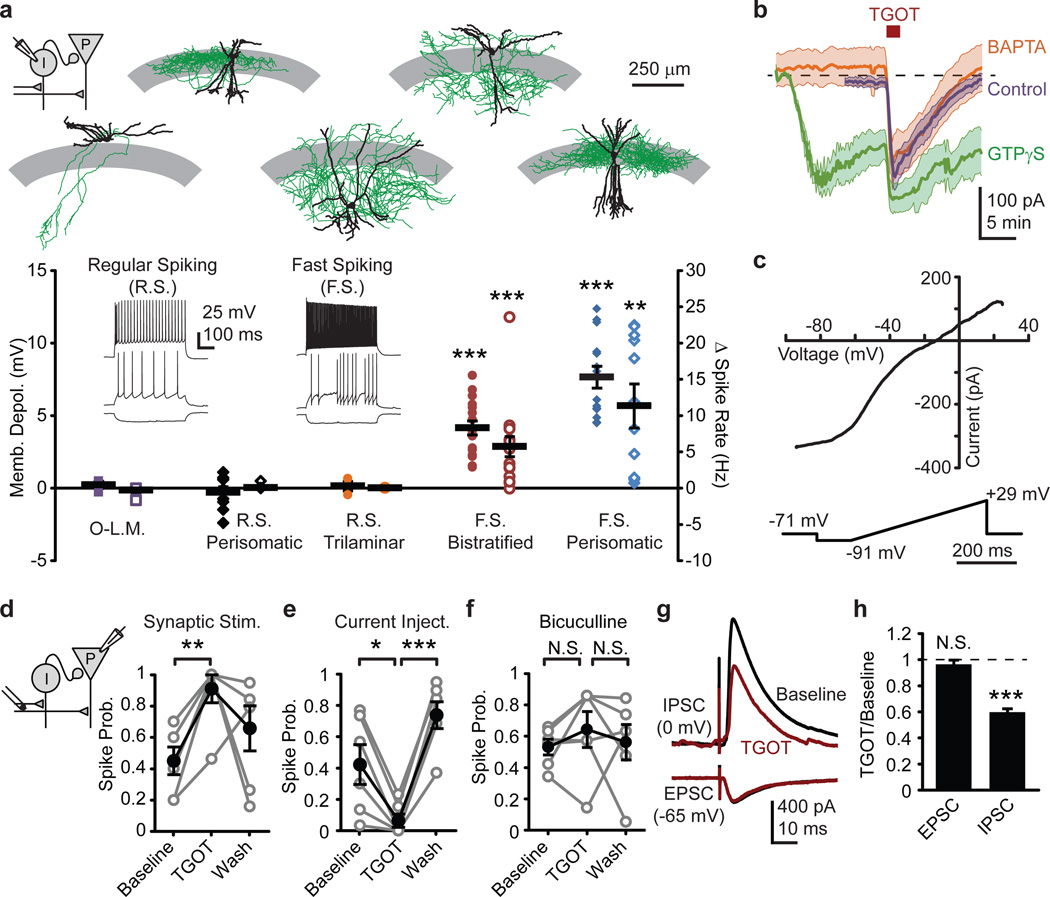
Figure 2. TGOT activates FSIs and suppresses feed-forward inhibition.
a, TGOT influence on membrane potential (filled symbols) and firing rate (open symbols). Exemplar electrophysiological identification of interneurons, inset. Above, exemplar biocytin-filled interneurons tracings (soma and dendrites, black; axon, green; stratum pyramidale, gray area). O-LM (N=3), RS basket (N=9), RS trilaminar (N=3), FS bistratified (N=16), and FS perisomatic-targeting (N=14). b, Voltage clamp recordings of average TGOT currents ±S.E.M (shaded) in FSIs with control, 10 mM BAPTA, and 1 mM GTPγS filled pipettes (N=7, each condition). c, Voltage-dependence of TGOT-induced current in exemplar FSI. d,e, Whole cell spike probability from synaptically (panel d) or current injection-evoked spikes (panel e) in the same set of pyramidal neurons (N=6 cells). f, Cell-attached, synaptically-evoked spike probability in bicuculline (N=6 cells, Probability: P>0.95; Latency: P>0.5; Latency variance: P>0.3). Reduced stimulus strength was sufficient to reach 50% spike transmission and spikes occurred at longer latencies and with more jitter than in control ACSF8. g, TGOT influence on average evoked disynaptic IPSC from one pyramidal cell and monosynaptic EPSC from a different pyramidal cell. h, Normalized group data for evoked EPSC (N=6 cells) and disynaptic IPSC (N=8 cells). Paired two-tailed t-test, all panels except panel d, which uses one-tailed t-test for compatibility with cell-attached results. *, P<0.05, **, P<0.01; ***, P<0.001. Error bars S.E.M.

