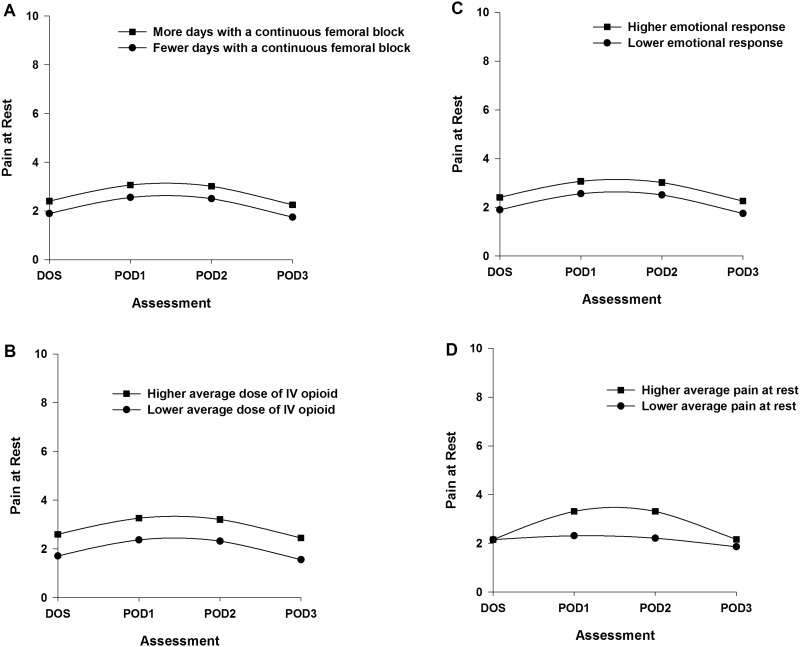
Figure 2.
Trajectories of pain at rest by number of days with a continuous femoral nerve block (A), average dose of intravenous opioid equivalents (B), emotional response to osteoarthritis (C), and average pain at rest on the day of surgery (D) from the day of surgery until postoperative day 3. Higher/lower differences in Figures 2A–C were calculated based on 1 standard deviation above/below the predicted value.

