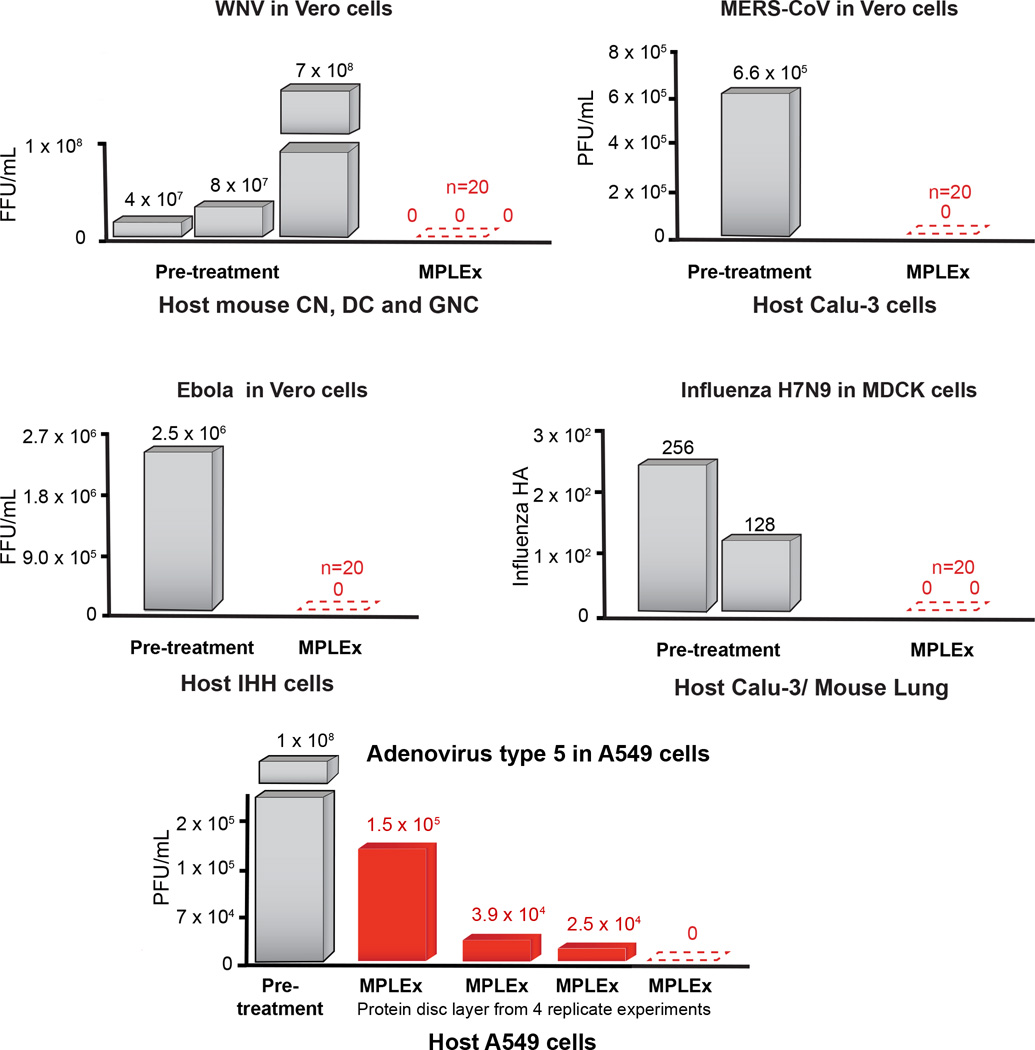
Figure 2. MPLEx Inactivation of Viral Pathogens.
The bargraphs depict the level of pathogen inactivation after MPLEx extraction by quantifying the number of Focus Forming Units (FFU) or Plaque Forming Units (PFU) in pre-treatment control samples (grey) and MPLEx-treated samples (red) in infection studies of West Nile (WNV, New York 1999), MERS-CoV (icMERS), Ebola (Ebola-Zaire delta-VP30) and Avian Influenza (H7N9).

