


Figure 3. Reliable multi-omic measurements resulting from MPLEx extraction of influenza infected Calu-3 cells.
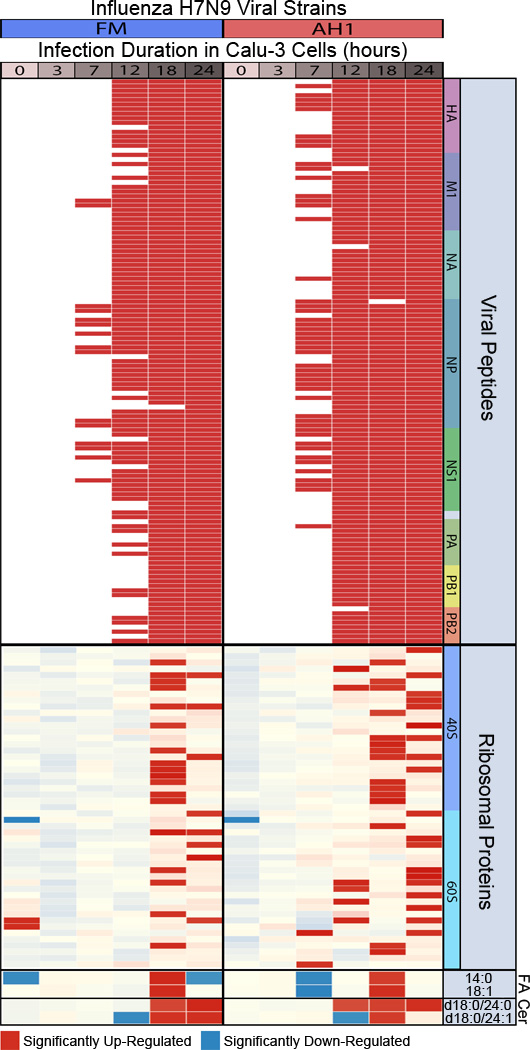
The heatmap depicts significant abundant changes between Calu-3 cells treated with wild-type (A/Anhui/1/13 [AH1]) and mutant (A/Anhui/103F-106M [FM]) Influenza H7N9 viral strains and time-matched (0, 3, 7, 12, 18 and 24 hours) mock-infected controls. Red color, significantly increase in virus vs. time matched mock (p-value < 0.05). The viral peptides labeled at the top of the heatmap include, hemagglutinin (HA), matrix protein 1 (M1), neuraminidase (NA), nucleoprotein (NP), non-structural (NS1), non-structural (NS2) (corresponds to the two unlabeled viral peptides), and polymerase complex proteins (PA, PB1, and PB2); fatty acids, FA; Ceramide lipids, Cer.