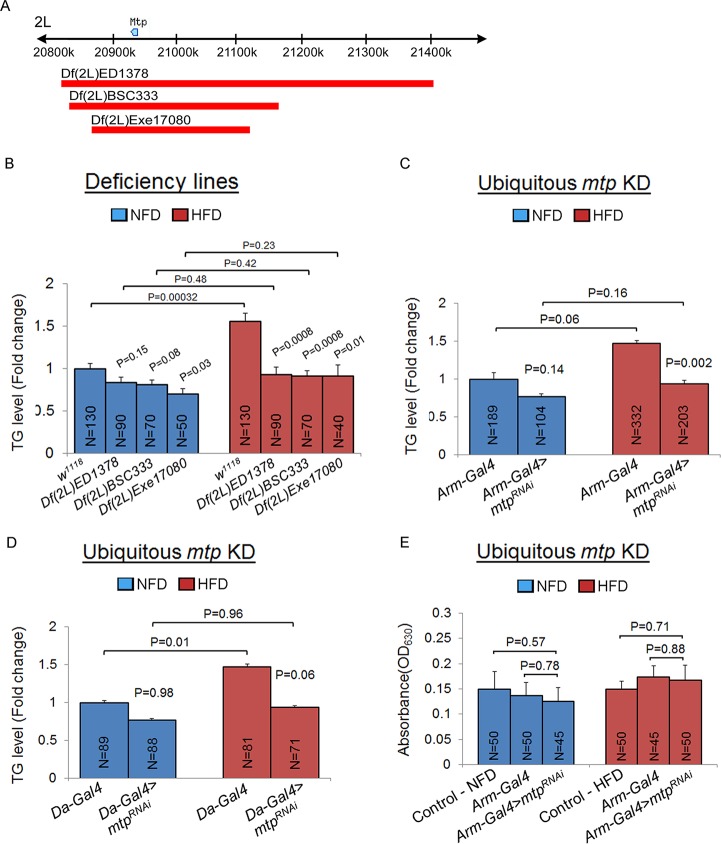
Fig 1. Genetic screening identifies Mtp as a gene for determining systemic lipid metabolism.
(A) Schematic of the results of the genetic screen showing the location of the mtp gene (blue symbol) on chromosome 2L. Red bars indicate deletions in the three deficiency lines investigated here: Df(2L)ED1378, Df(2L)BSC333, and Df(2L)Exel7080. (B) Whole-body TG levels of newly eclosed control (w1118) flies and deficiency lines on NFD or HFD. For each genotype, a 1:1 ratio of males:females was analyzed. P-values are from Student’s t-test and are between control w1118 and deficiency lines within NFD or HFD, or between NFD and HFD for the same genotype. (C) Whole-body TG levels of newly eclosed control flies (Arm-Gal4), and flies with whole-body KD of mtp (Arm-Gal4>mtpRNAi) on NFD and HFD. For each genotype, a 1:1 ratio of males:females was analyzed. P-values are from Student’s t-test and are between Gal4 control and Gal4-mediated RNAi lines within NFD or HFD, or between NFD and HFD for the same genotype. (D) Whole-body TG levels of newly eclosed control flies (Da-Gal4), and flies with whole-body KD of mtp (Da-Gal4>mtpRNAi) on NFD and HFD. For each genotype, a 1:1 ratio of males:females was analyzed. P-values are from Student’s t-test and are between Gal4 control and Gal4-mediated RNAi lines within NFD or HFD, or between NFD and HFD for the same genotype. In (B), (C) and (D), TG levels (μg/μl) were normalized to total protein (μg/μl). Results are expressed as the fold change in whole fly normalized TG compared with that of the wild-type w1118 or Gal4 control flies on NFD (set to 1.0). Results are the mean ± SEM of the indicated number of flies (N) analyzed over at least 5 independent experiments. (E) Colorimetric assay of food intake in control w1118 third instar larvae and third instar larvae with Gal4 driver only (Arm-Gal4) or with whole body knockdown of mtp using Arm-Gal4 (Arm-Gal4>mtpRNAi). Results are the mean ± SEM of the indicated number of larvae (N) analyzed over 3 independent experiments. P-values are from Student’s t-test.

