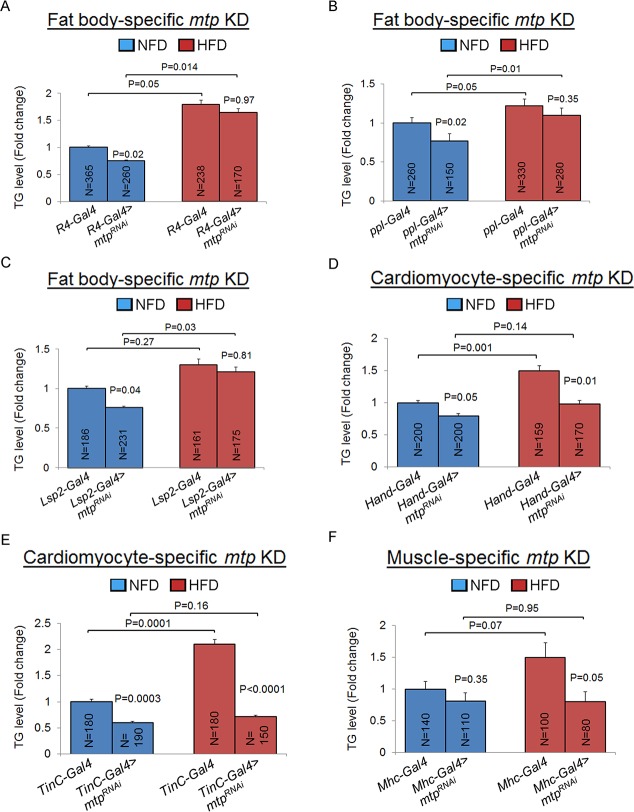
Fig 2. Fat body and cardiomyocyte Mtp regulate systemic lipid metabolism differently on normal food diet and high fat diet.
(A–C) Whole-body TG levels of newly-eclosed flies with Gal4 drivers only (controls) or with fat body-specific knockdown of mtp using R4-Gal4 (A), ppl-Gal4 (B), or Lsp2-Gal4 (C) on NFD (blue) or HFD (red). (D-E) Whole-body TG levels of newly-eclosed flies with Gal4 drivers only (controls) or with cardiomyocyte-specific knockdown of mtp using Hand-Gal4 (D), or TinC-Gal4 (E) on NFD (blue) or HFD (red). (F) Whole-body TG levels of newly-eclosed flies with Gal4 drivers only (controls) or with muscle-specific knockdown of mtp using Mhc-Gal4 on NFD (blue) or HFD (red). In all cases, TG levels (μg/μl) were normalized to total protein (μg/μl). Results are expressed as the fold change in whole fly normalized TG compared with that of the Gal4 control flies on NFD (set to 1.0). Results are the mean ± SEM of the indicated number of flies (N) analyzed over at least 5 independent experiments. P-values are from Student’s t-test and are between Gal4 control and Gal4-mediated RNAi lines within NFD or HFD, or between NFD and HFD for the same genotype.

