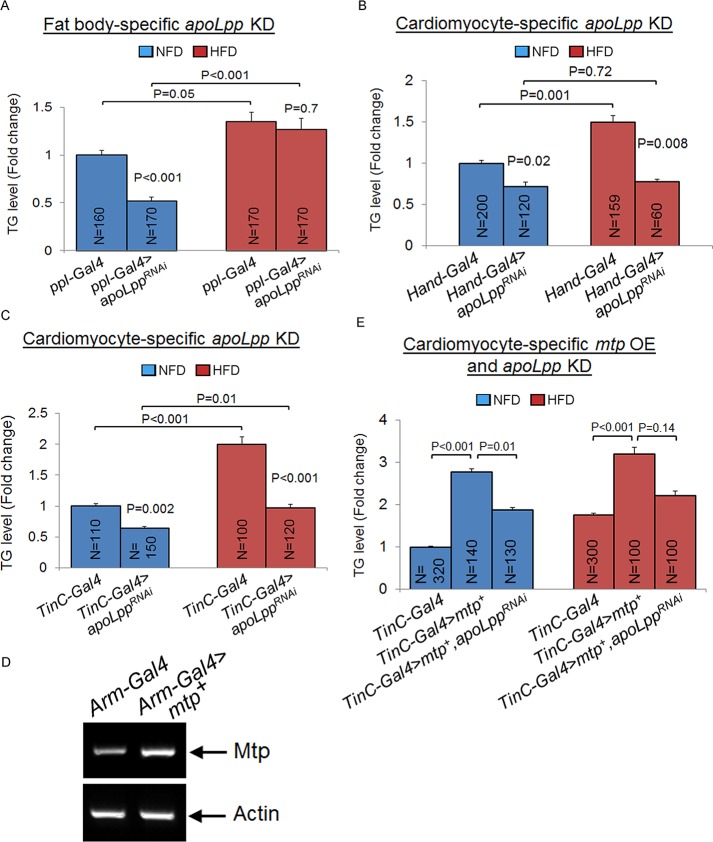
Fig 3. Fat body and cardiomyocyte apoLpp regulate systemic lipid metabolism differently on normal food diet and high fat diet.
(A) Whole-body TG levels of newly-eclosed flies with Gal4 driver only (control) or with fat body-specific knockdown of apoLpp using ppl-Gal4 (A) on NFD (blue) or HFD (red). (B, C) Whole-body TG levels of newly-eclosed flies with Gal4 drivers only (controls) or with cardiomyocyte-specific knockdown of apoLpp using Hand-Gal4 (B), or TinC-Gal4 (C) on NFD (blue) or HFD (red). (D) RT-PCR analysis of mtp mRNA levels in whole flies with Arm-Gal4 driver only (control) or with Arm-Gal4-induced overexpression of full-length mtp (mtp+). Actin serves as an internal control. (E) Whole-body TG levels of newly-eclosed flies with Gal4 driver only (control), with cardiomyocyte-specific overexpression of mtp+ using TinC-Gal4, or with cardiomyocyte-specific overexpression of mtp+ and apoLppRNAi using TinC-Gal4 on NFD (blue) or HFD (red). In A-C and E, TG levels (μg/μl) were normalized to total protein (μg/μl). Results are expressed as the fold change in whole fly normalized TG compared with that of the Gal4 control flies on NFD (set to 1.0). Results are the mean ± SEM of the indicated number of flies (N) analyzed over at least 5 independent experiments. P-values are from Student’s t-test and are between Gal4 control and Gal4-mediated RNAi lines within NFD or HFD, or between NFD and HFD for the same genotype.

