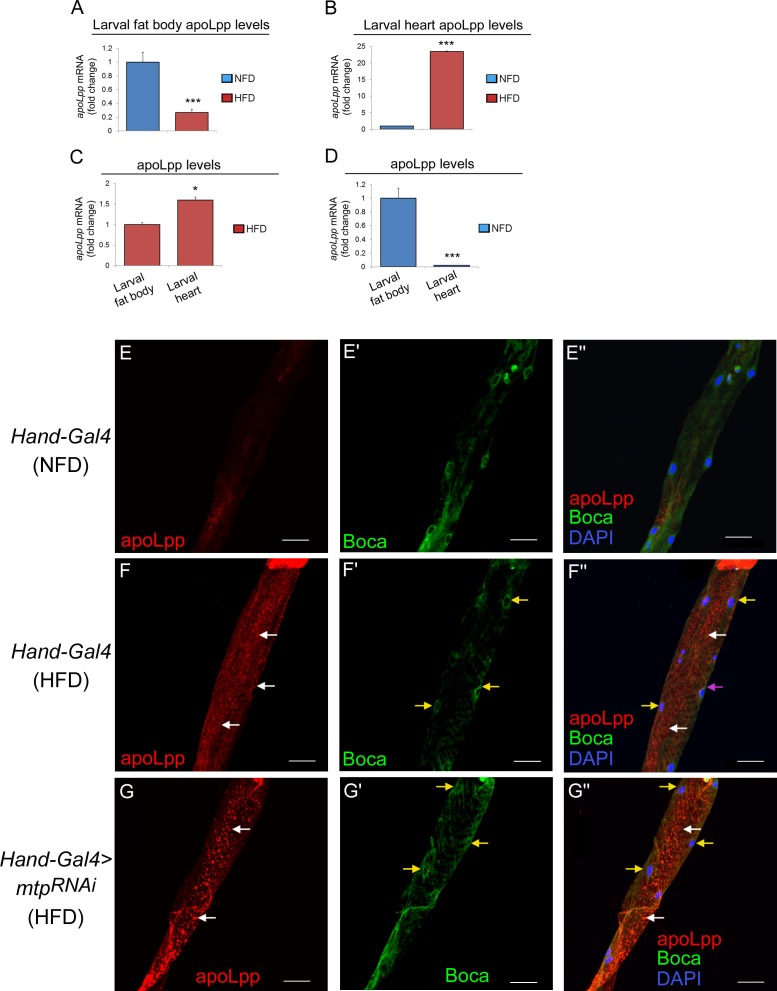
Fig 6. High fat diet alters relative apoLpp expression levels in the cardiomyocytes and fat body.
(A, B) Relative mRNA levels of apoLpp in larval fat body (A) and larval hearts (B) on NFD and HFD. Results are expressed as the fold difference compared with the NFD condition. Values were normalized with gapdh. ***p < 0.001, by two-tailed paired t-test analyzed over 3 independent experiments. (C) Relative mRNA levels of apoLpp in in larval heart relative to larval fat body on HFD. Results are expressed as the fold difference. Values were normalized with gapdh. *p < 0.05, ***p < 0.001, by two-tailed paired t-test analyzed over 3 independent experiments. (D) Relative mRNA levels of apoLpp in larval heart relative to larval fat body on NFD. Results are expressed as the fold difference. Values were normalized with gapdh. *p < 0.05, ***p < 0.001, by two-tailed paired t-test analyzed over 3 independent experiments. (E-E”) Representative confocal images of apoLpp (E), Boca (E’), and apoLpp, Boca and DAPI (E”) in cardiomyocytes of the Hand-Gal4 control third instar larvae on NFD. Scale bars represent 40 μm. Boca marks the endoplasmic reticulum and DAPI marks the nucleus in each cardiomyocyte. (F-F”) Representative confocal images of apoLpp (F), Boca (F’), and apoLpp, Boca and DAPI (F”) in cardiomyocytes of the Hand-Gal4 control third instar larvae on HFD. White arrows in F and F” indicate the apoLpp puncta which reflect the presence of Lpp. Yellow arrows in F’ and F” indicate the endoplasmic reticulum marker Boca, and DAPI marks the nuclei in the cardiomyocytes. The magenta arrow in F” indicates the co-localization of apoLpp and Boca. Scale bars represent 40 μm. (G-G”) Representative confocal images of apoLpp (G), Boca (G’), and apoLpp, Boca and DAPI (G”) in cardiomyocytes of the Hand-Gal4-mediated mtp KD third instar larvae on HFD. White arrows in G and G” indicate the strong punctate staining of apoLpp which reflects the accumulation of Lpp. Yellow arrows in G’ and G” indicate the endoplasmic reticulum marker Boca, and DAPI marks the nuclei in the cardiomyocytes. Scale bars represent 40 μm.

