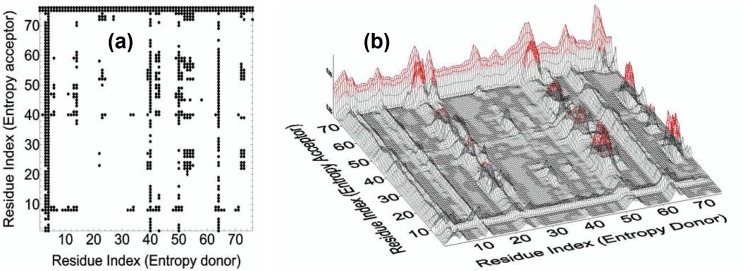
Fig 3.
a. Entropy transfer from residue i to residue j. Abscissa represents residues which provide entropy to residues shown along the ordinate. Entropy transferred from residue i to residue j is obtained from Eq 16. Values between 0.0035–0.35 are recorded. Values below 0.0035 are not shown in order not to crowd the figure. Ti→j(τ) values are calculated from Eq 16 with τ = 5 ns., b. Three dimensional description of entropy transfer in Ubiquitin. Red regions denote the residues with large contributions to transfer entropy. The figure is a 3-D version of Fig 3A.

