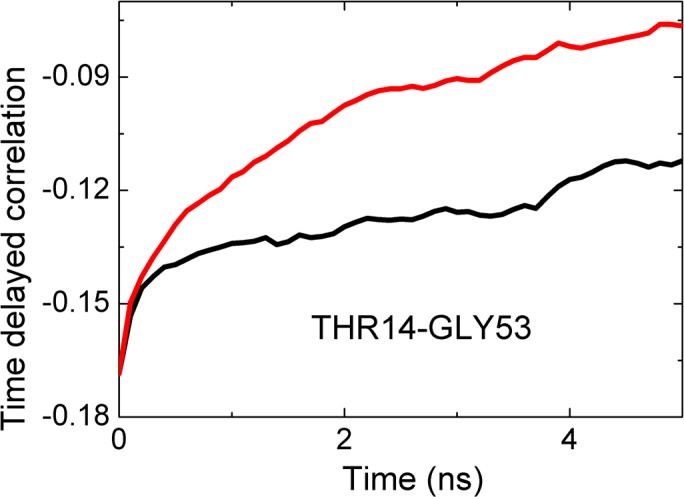
Fig 10. Cross correlation of fluctuations of THR14 and GLY53.

Black line is for correlations where THR14 precedes GLY53. The red line is for correlations whereGLY53 precedes THR14. The abscissa denotes the time delay parameter, i.e., the time between two observations, one at time zero the other at the indicated time on the axis. The curves are calculated from Eq 7.
