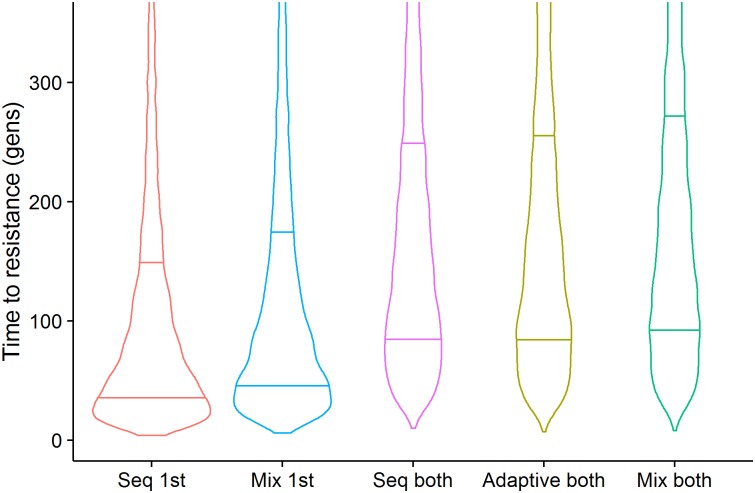
Fig 4. A Violin plot of the times, in mosquito generations, for resistance allele frequency to reach 50%.
The width of the plot indicates density of points and the horizontal bars the 25% and 75% quartiles. The results were obtained from the sensitivity analysis described on Table 4. “Seq 1st” is the distributions of times until resistance to the first insecticide deployed in the sequence reaches 50%. This is equivalent to the times that would occur if insecticides are used alone. “Mix 1st” is the time until resistance reaches 50% against either insecticide deployed in a mixture. “Seq both” is the time until resistance has exceeded 50% to both insecticides that were deployed in sequence. “Adaptive both” shows the time until resistance is reached for both insecticides in a mixture when the first to reach resistance has been adaptively withdrawn (because there is widespread resistance to it). “Mix both” is the time until resistance alleles frequency exceeds 50% for both insecticides in a non-adaptive mixture.

