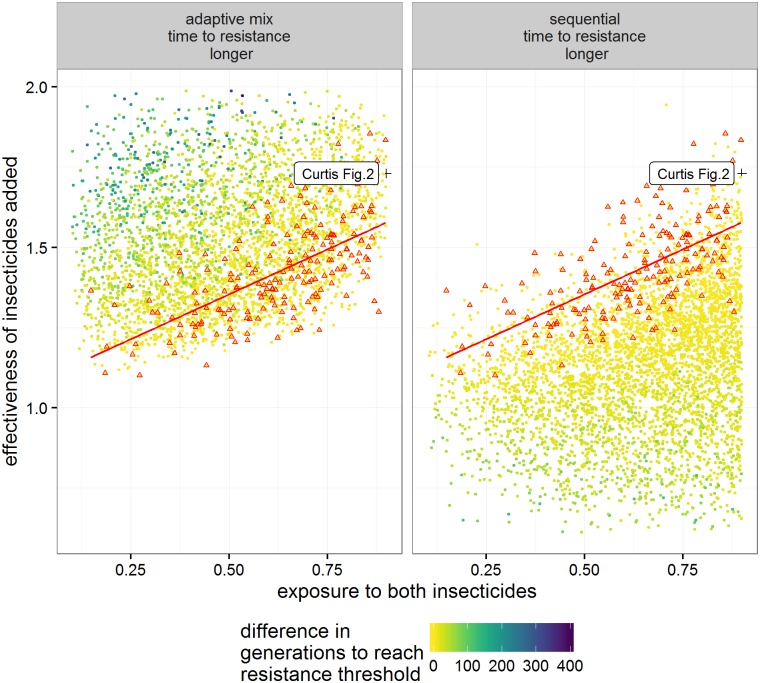
Fig 9. Using insecticide effectiveness and exposure to determine whether time to resistance to the insecticides is longer using Adaptive mixture or Sequential strategies.
Our analyses suggested that insecticide effectiveness and levels of insecticide exposure were key determinants of whether mixtures outperformed sequential deployment, or vice versa. We investigate how well they combine to predict optimal strategy by constructing this figure based on two axes: (i) “Effectiveness”, defined as the sum of effectivenesses of insecticide 1 and 2 against the SS genotypes(see Table 4 for details), and (ii) “Exposure”, defined as the proportion of female mosquitoes that encounter the insecticide. The difference in times until resistance under the two strategies are indicted by colour coding as shown on the Figure key. The black cross indicates the values used by Curtis in his Fig 2 in [17]. Red triangles are those runs in which time to resistance is identical for the two strategies (and are repeated in both panels). The red line is a linear model through these same points, and is described by Eq 7 in the main text.

