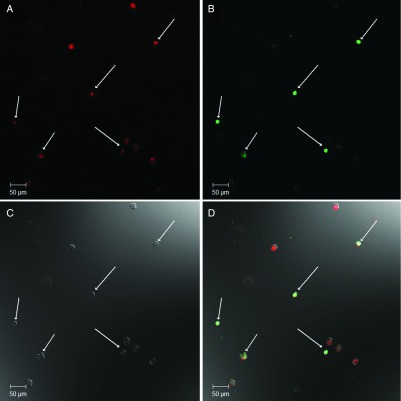
Fig. 2.
BrdU labeled hAECs in vitro. Red color represents the nuclear Hoechst staining (Panel A). Green color represents the BrdU (Panel B). Panel C shows the transmitted light. Co-localization of the red and green colors represents the successful BrdU labeling (white arrows, Panel D). The image was taken at 20× magnification with ZEISS LSM 510 Meta confocal laser scanning microscope

