Figure 7.
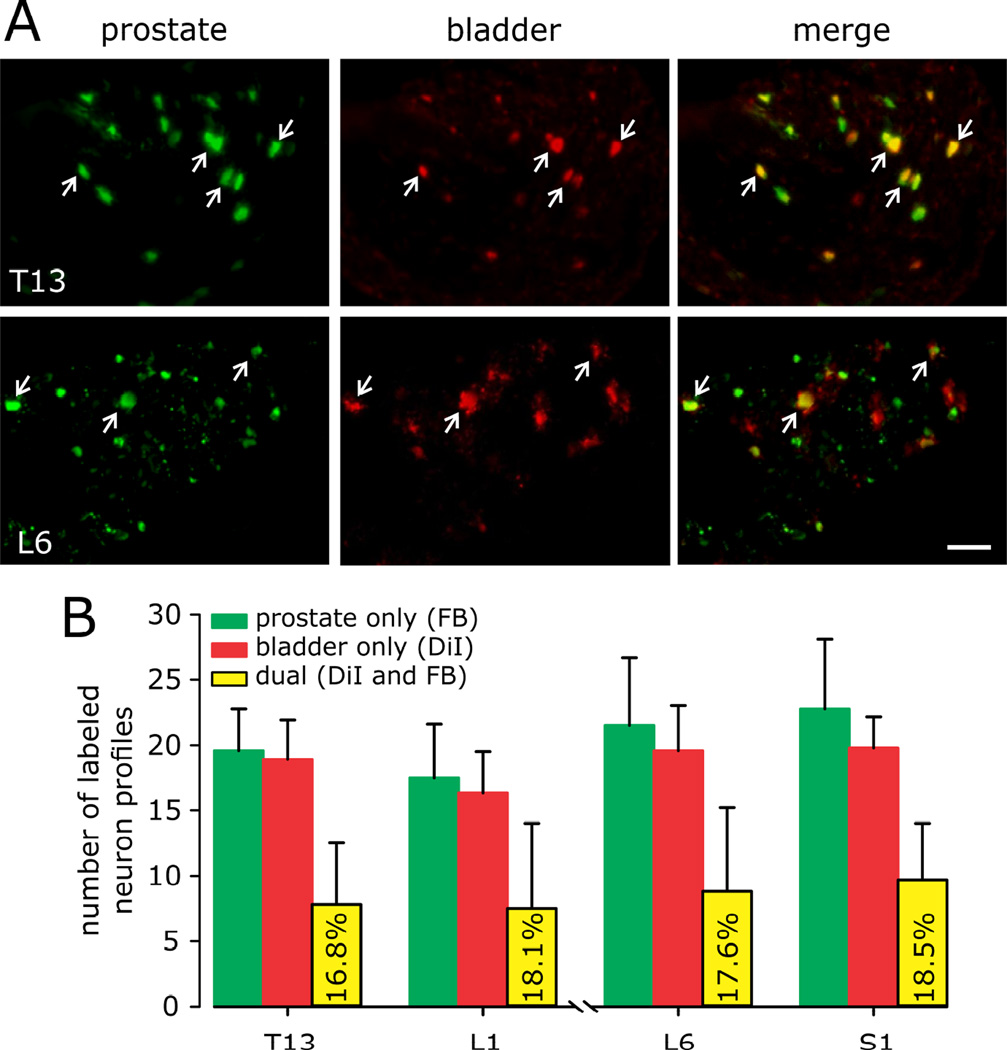
Quantification of neuron profiles in dorsal root ganglia (DRG) retrogradely labeled from prostate (FB) and bladder wall (with DiI). Labeling in T13-L1 DRG represents the hypogastric/lumbar splanchnic nerve innervation; labeling in L6-S1 DRG represents the pelvic nerve innervation. Photomicrographs (A) of FB-positive (green), DiI-positive (red), and FB and DiI-positive (yellow) retrogradely labeled somata in T13 and L6 DRG from control mice. Positive profiles are indicated by white arrows (scale bar= 50µm). B: Number of retrogradely labeled DRG neurons by counting neuron profiles in every fifth 12 µm thick cryostat section (i.e., 60 µm between counted sections) in five sections/ganglion to avoid double counting of cells. Ganglia were taken bilaterally and a mean of counted neuron profiles was determined for each pair of ganglia. n=6 mice/group.

