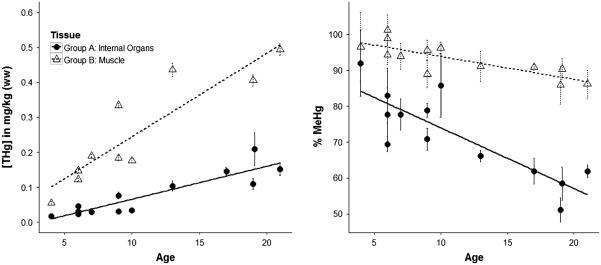
Fig. 4.
Concentration of total Hg ([THg]) and percent methylmercury of THg (%MeHg+) in two groups of tissues of shorthorn sculpin. Groups were assigned using post hoc Games–Howell as in Fig. 3, where Group A represents the mean values for muscle A, B, C, and D, while Group B represents the mean value for heart, kidney, and liver. Error bars represent mean ± standard error

