Figure 1.

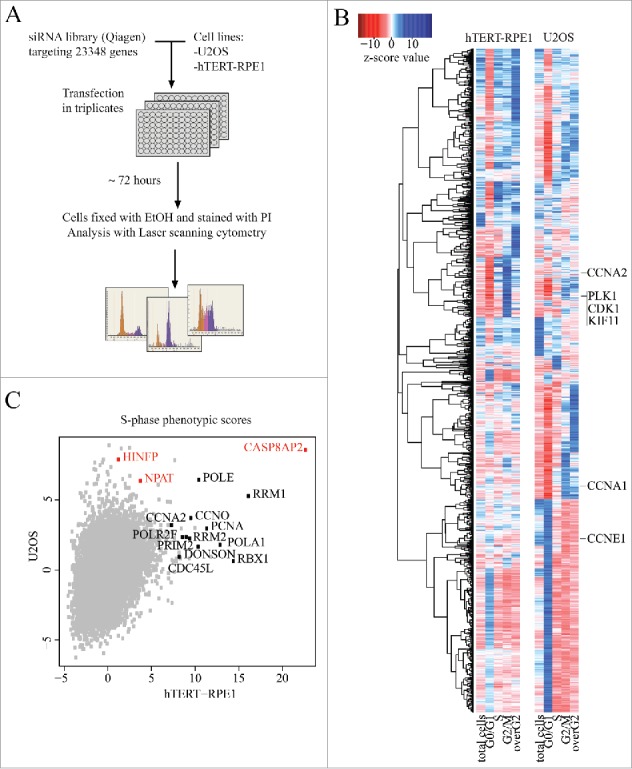
Genome-wide RNAi screen comparing normal and tumor cells. (A) Schematic representation of genome-scale RNAi screening in human immortalized (hTERT-RPE1) and cancer (U2OS) cell lines. (B) Hierarchical clustering of cell cycle regulators (z-score for at least one parameter is >5 or <−5) based on their phenotypic scores (for full data, see Supplementary Table S1). Note that known genes required for cell division (e.g., CDK1, KIF11, PLK1) cluster together for both cell lines. (C) S-phase z-scores in hTERT-RPE1 and U2OS cell lines. Most S-phase arrested hits for hTERT-RPE1 are genes involved in DNA replication and S-phase progression (marked black). Transcriptional regulators of histone genes are marked in red.
