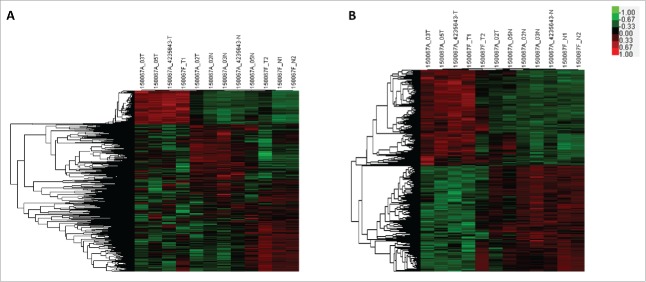
Figure 1.
Microarray analysis of lncRNA and mRNA expression in thyroid tissues. Hierarchical clustering analysis of differentially expressed lncRNA (A) and mRNA (B) between PTC tissues and noncancerous thyroid tissues (Fold change ≥ 2, p < 0.05). Red indicates high relative expression, while green indicates low relative expression. In the heat map, columns represent samples and rows represent each lncRNA or mRNA.

