. 2017 Jan 31;6:e18904. doi: 10.7554/eLife.18904

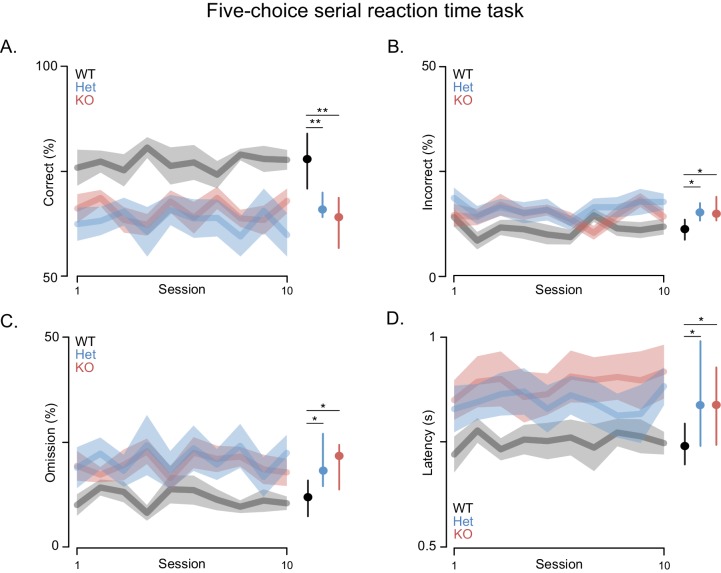
Figure 3. Shank3-deficient rats exhibit deficits in attention.

(A) Traces and clouds indicate mean percentage of trials with a correct response ± SEM (WT, n = 10; Het, n = 13; KO, n = 12) across 10 5-CSRT sessions. The right side in all panels is the cross-rat median (dot) and middle quartiles (vertical lines). (B) Traces represent mean percentage of trials where an incorrect response was made. (C) Mean percentage of trials with no cued response. (D) Average reaction times on trials with a correct response. Results were observed in two independent cohorts; therefore, the results were pooled.

DOI: http://dx.doi.org/10.7554/eLife.18904.007

Figure 3.

Figure 3—figure supplement 1. Shank3-deficient rats exhibit normal motivation for reward and task performance is at WT levels when cue durations are long.

Figure 3—figure supplement 1.

(A) Traces and clouds show the average latency ± SEM from a correct screen touch to entry into a reward receptacle for WT (black, n = 10), Shank3 Het (blue, n = 13), or KO rats (red, n = 12) across ten 5-CSRT sessions. (B) Scatter plots, presented with mean ± SEM, show percent of correct, incorrect, or omitted trials for each individual subject during this 5-CSRT test training stage. In this 5-CSRT training stage, the light cues remain on for 5 s. *p<0.05, **p<0.01; See Supplementary file 1 for detailed statistical results.