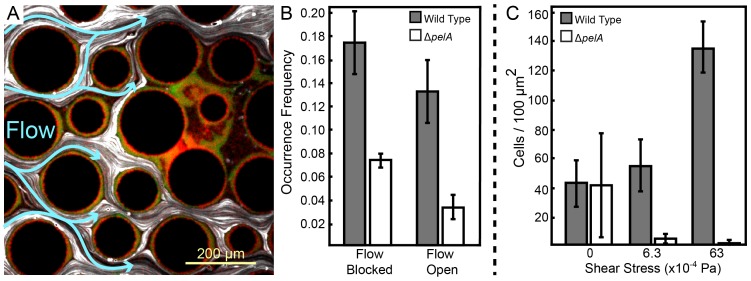
Figure 3. Pel-deficient mutants occupy locations protected from flow due to local clogging by wild-type P. aeruginosa biofilms.
(A) Wild-type (green) and ∆pelA (red) P. aeruginosa strain mixtures were inoculated into complex flow chambers with irregularly-spaced column obstacles. Biofilms were imaged using confocal microscopy, after which fluorescent beads were flowed through the chamber. The presence or absence of flow was monitored through averaging successive exposures of bead tracks (white lines are bead tracks; blue arrows highlight flow trajectories). (B) Analysis of co-occurrence of flow and wild-type or ∆pelA cell growth at the end of 1:1 competition experiments in complex flow chambers with column obstacles, as illustrated by the micrograph in (A). The occurrence of wild-type (gray) and ∆pelA (white) cell clusters are shown as a function of whether local flow has been blocked or remained open after 72 hr of competition (bars denote means ± S.E. for n = 3). These occurrence frequency data are normalized to the total area of blocked versus open flow in the microfluidic devices, as determined by the presence or absence of fluorescent bead tracks. There is no significant difference in wild type occurrence in regions in which flow is unobstructed and in regions in which flow is blocked (two-sample t = 0.995, df = 4, p=0.376), but the ∆pelA strain is significantly more likely to occur in regions in which flow is blocked at a p<0.05 threshold with Bonferroni correction for two pairwise comparisons (two-sample t = 3.60, df = 4, p=0.0227). (C) Biofilm growth of wild-type P. aeruginosa PA14 (gray) and the ΔpelA mutant (white) in monoculture in planar flow chambers under different shear stress exposure treatments (bars denote means ± S.D. for n = 5–10).
DOI: http://dx.doi.org/10.7554/eLife.21855.009
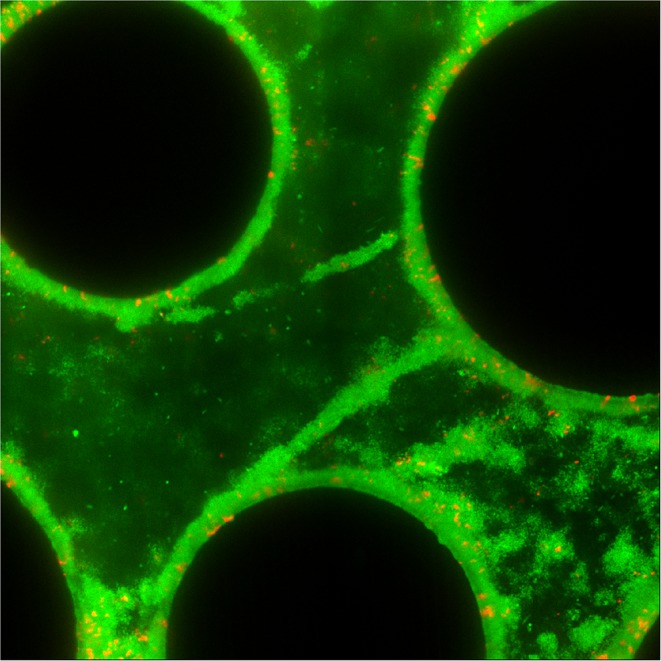
Figure 3—figure supplement 1. Streamer structures produced by wild-type P. aeruginosa PA14 (green) in microfluidic chambers with complex flow profiles do not capture large numbers of co-cultured ∆pelA mutants (red) over 72 hr of biofilm growth (black circles are column obstacles).

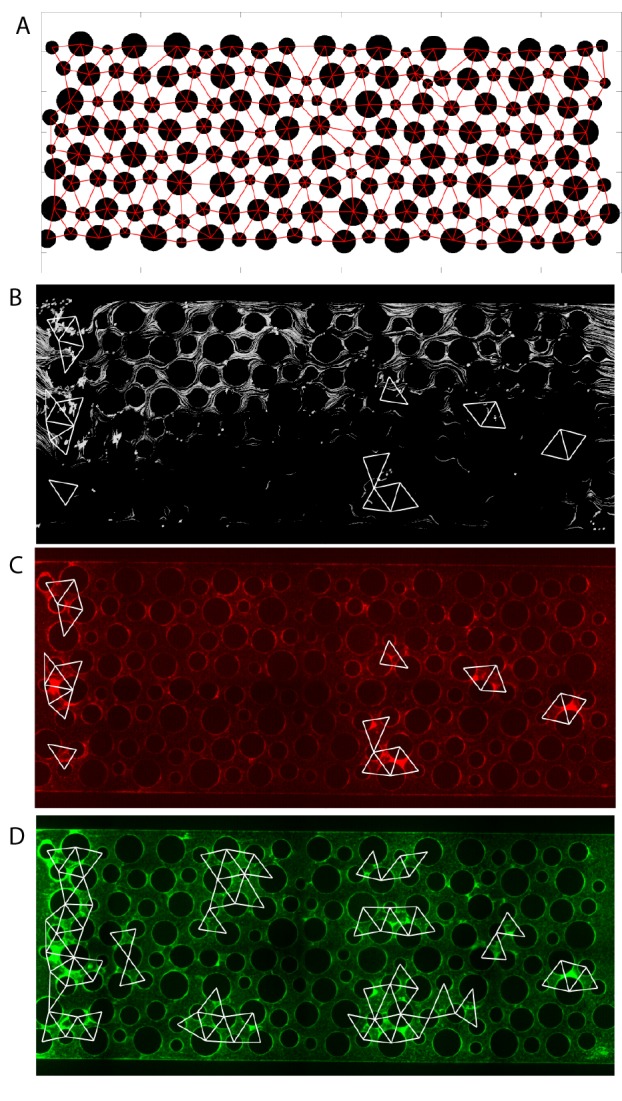
Figure 3—figure supplement 2. Analysis procedure for correlating local flow and accumulation of ∆pelA and wild-type cells.

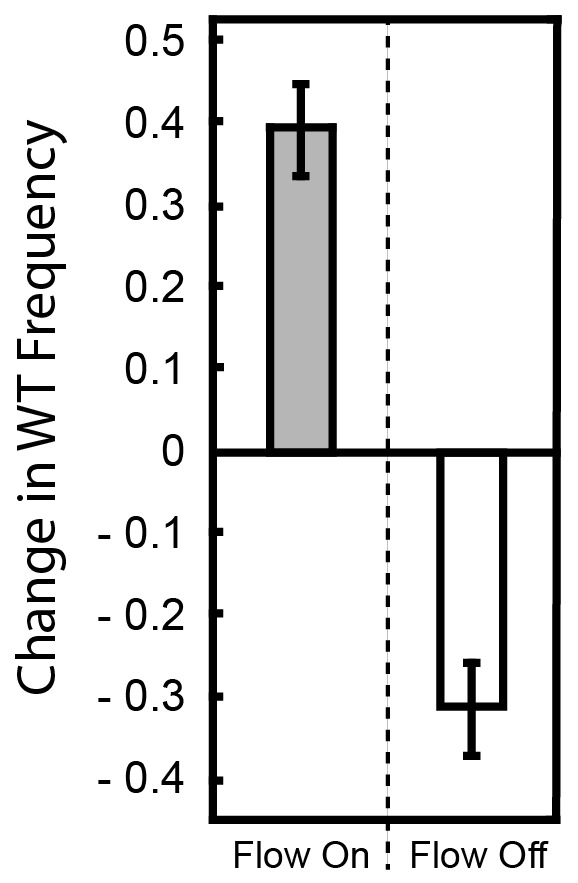
Figure 3—figure supplement 3. Change in frequency of WT cells from a 1:1 starting population with ∆pelA with and without flow.


