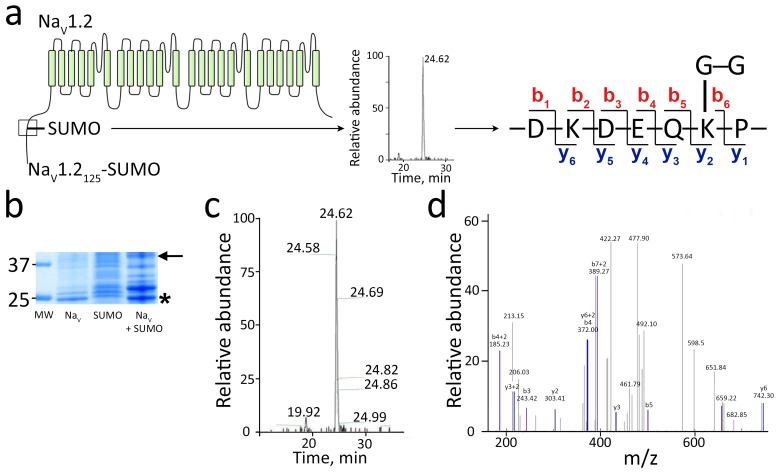
Figure 6. Mass spectroscopy shows SUMO1 conjugated to NaV1.2-Lys38.
For MS analysis, rat NaV1.21-125 and SUMO197T95K were expressed with mouse SUMOylation enzymes in E. coli, purified, subjected to trypsin cleavage, and analyzed by MS as described in the Materials and methods. (a) Left, schematic showing the product NaV1.21–125-SUMO (box) and the trypsin fragment of NaV1.2 carrying the Gly-Gly remnant of SUMO197T95K. Right, The sequence of the three-ended fragment with Lys38 and the Gly-Gly remnant. (b) A Coomassie blue-stained SDS–PAGE gel of the purified products. Unmodified NaV1.21–125 (NaV) migrates at ~25 kDa (star). Expression of SUMO197T95K (SUMO) and the SUMO enzymes yields SUMO on the overexpressed target as well as native proteins (Plant et al., 2011; Uchimura et al., 2004). The NaV1.21–125-SUMO conjugate migrates at ~40 kDa (arrow). Molecular weight markers are shown (MW). (c) Fourier transform mass spectrum after trypsin digestion of NaV1.21–125-SUMO expressed as relative abundance against time of capture. The predicted fragment of 422.27 Da was captured as a single peak at 24.62 min. (d) Tandem MS sequence analysis of the fragment with Lys38 and the Gly-Gly remnant indicating b and y ion species as annotated in a.

