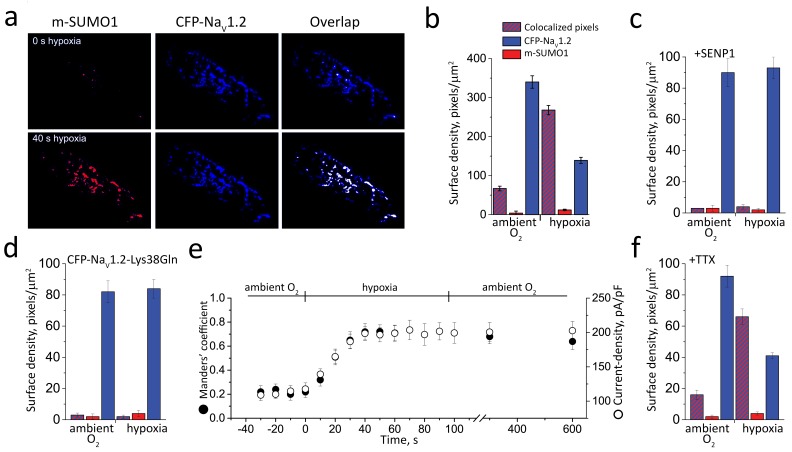
Figure 8. Hypoxic SUMOylation of NaV1.2 and current density proceed concurrently.
CFP-NaV1.2 or CFP-NaV1.2-Lys38Gln (K38Q, blue) channels and SUMO1 tagged with mCherry (m-SUMO1, red) were studied in CHO cells by TIRFM and pixel-by-pixel analysis performed as described in the Materials and methods. Briefly, images were captured at 5 s intervals and data for each fluorophore saved as separate stacks; the background was subtracted and processed for misalignment in an identical manner. Manders’ coefficients were assessed post-hoc for 3–5 regions per cell. Co-localization was defined as the presence of both fluorophores at more than 30% of the maximum fluorescence level recorded in that stack (and their overlap is represented in the images as white pixels). The time-course of hypoxic modulation of NaV1.2 current in moving from O2 of 21% to 5% was studied with steps from –100 mV to −20 mV every 10 s and normalized to cell capacitance (pA/pF). Data represent 5–8 cells and biophysical parameters and single particles statistical analyses are summarized in Supplementary file 1a and Table 2, respectively. (a) Hypoxia rapidly recruits SUMO1 to the cell surface at sites with NaV1.2 channels. The images show that the surface density of m-SUMO1 (top, left) is low compared to CFP-NaV1.2 (top, middle) with little co-localization (top, right) in ambient O2. After 40 s of hypoxia, rapid recruitment of SUMO1 (bottom, left) to the surface is observed to be at sites with NaV1.2 channels (bottom, left). Surface levels of NaV1.2 were not observed to change when cells were exposed to hypoxia (bottom, middle). (b) Histogram of surface density summarizing seven cells studied as described in a and Table 2. The density of pixels per µm2 with SUMO1 alone (red) was 4 ± 5, with NaV1.2 alone (blue) was 340 ± 16, and with both subunits was 67 ± 6 (red/blue hatch). Hypoxia increased co-localization to 268 ± 12 pixels per µm2 and decreased the density of free NaV1.2 channels (139 ± 8) without altering the density of free SUMO1 (12 ± 2). (c) The hypoxia-induced increase in the surface density of single fluorescent particles with both SUMO1 and NaV1.2 was not observed in cells with 100 nm SENP1 in the pipette. (d) Hypoxia-induced increase in the surface density of SUMO1 was not observed in cells expressing CFP-tagged NaV1.2-Lys38Gln (K38Q). (e) The time-course for hypoxia-induced increase co-localization of NaV1.2 and SUMO1 (Manders’ coefficient, solid circle) and current-density (pA/pF, open circle) were coincident. The mean Manders’ coefficient of 0.22 ± 0.08 measured in ambient O2 increased to 0.72 ± 0.12 in less than 40 s of acute hypoxia. The current density increased from −120 ± 8 to 198 ± 10 pA/pF. Increases in the Manders’ coefficient and current density were unchanged 10 min after cells were restored to ambient O2. (f) Hypoxia-induced increase in the surface density of colocalized SUMO1 and NaV1.2 was also observed when cells were treated with 5 µm tetrodotoxin (TTX), a level that blocked over 95% of the Na+ current.

