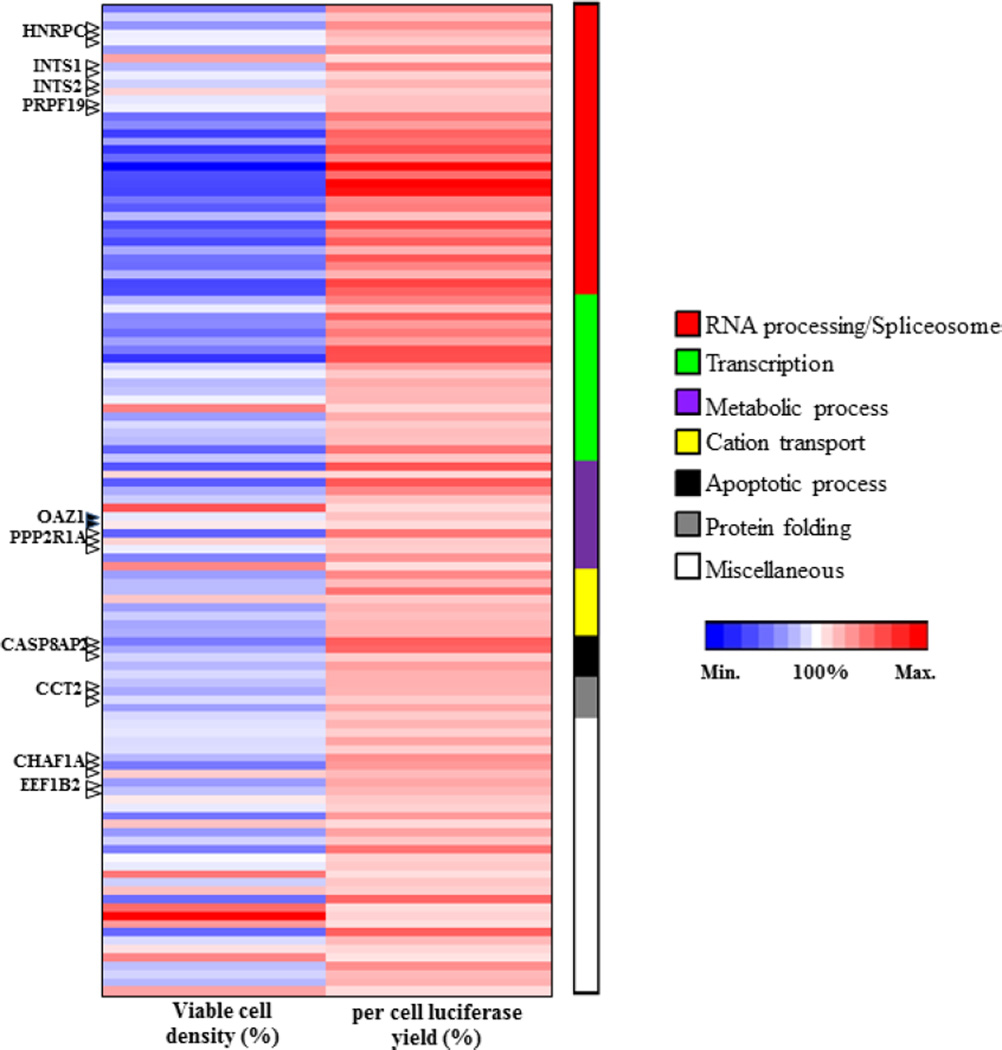
Fig. 2. Functional categorization of strong enhancer siRNA-associated genes.
Heat map was generated based on percent viable cell density and per cell luciferase yield for each of the 119 siRNAs that significantly enhanced luciferase production. The values are indicated by range of red (maximum) and blue (minimum) intensities. The functional categories are indicated by bars of different colours and the numbers of siRNAs in each group indicated by the bar lengths.

