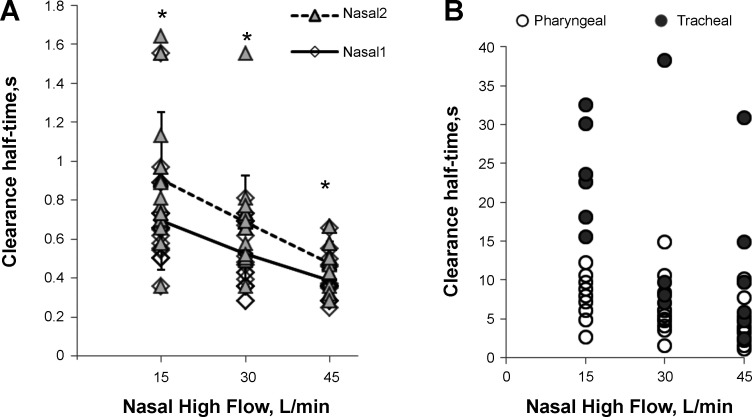
Fig. 2.
81mKr gas clearance half-times of the anterior (Nasal1) and posterior (Nasal2) nasal cavity (A) and in the pharyngeal and tracheal space (B) during NHF rates of 15, 30, and 45 l/min. This figure demonstrates flow-dependent clearance (Nasal1 vs. NHF, cc = −0.55, P < 0.01; Nasal2 vs. NHF, cc = −0.57, P < 0.01) that was always faster in the Nasal1 ROI than in the Nasal2 ROI, which shows a direction of clearance. Data are means ± SD; *P < 0.05, paired t-test.

