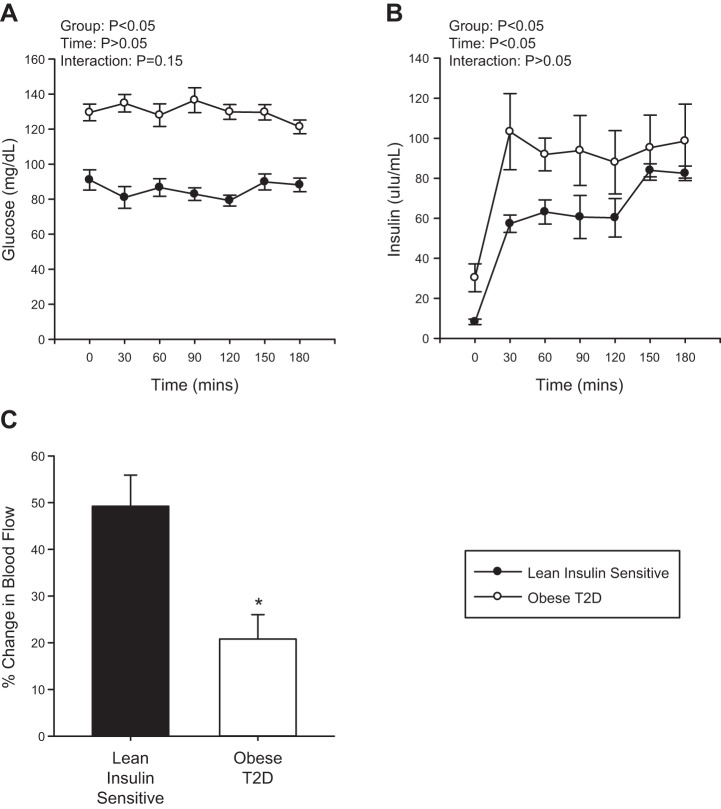
Fig. 1.
Serum glucose (A) and insulin (B) levels during the hyperinsulinemic-euglycemic clamp in Lean individuals and obese individuals with type 2 diabetes (T2D). Percent change in femoral artery blood flow from basal to 45 min of insulin stimulation in the Lean individuals and obese individuals with T2D (C). Black circles represent the Lean individuals and the open circles represent the obese T2D individuals. All samples were derived at the same time and processed in parallel. Values are means ± SE. *P < 0.05 from Lean.

