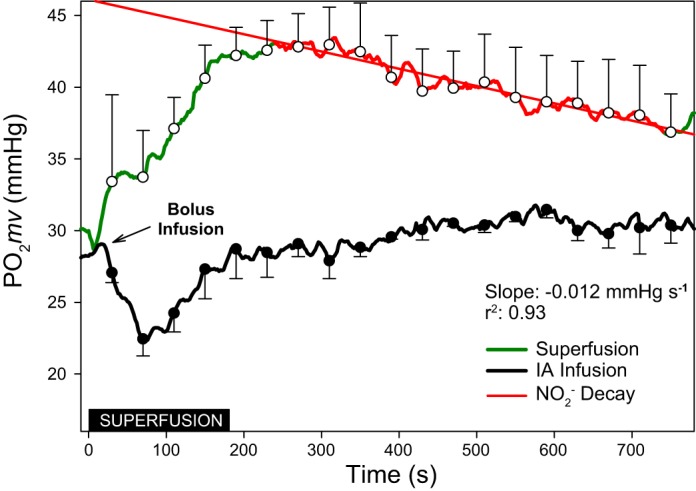
Fig. 1.

Averaged microvascular O2 driving pressure (Po2mv) from results (n = 3) during 180 s of NaNO2 superfusion (30 mM in Krebs-Henseleit solution) and a bolus (~10 s) intra-arterial infusion of NaNO2 (7 mg/kg in 0.4 ml heparinized saline solution). Inset: black box denotes the superfusion period. Measurements were recorded for an additional 600 s to monitor the effects of direct vs. systemic administration in the absence of muscle contraction. Following the bolus intra-arterial infusion Po2mv declined at a rate of −0.098 mmHg/s (regression not shown) before returning to baseline levels. In the superfusion condition, following the initial increase and plateau in Po2mv, there was a decline in Po2mv at the rate of −0.012 mmHg/s. Data are presented as means ± SE every 30 s throughout each condition.
