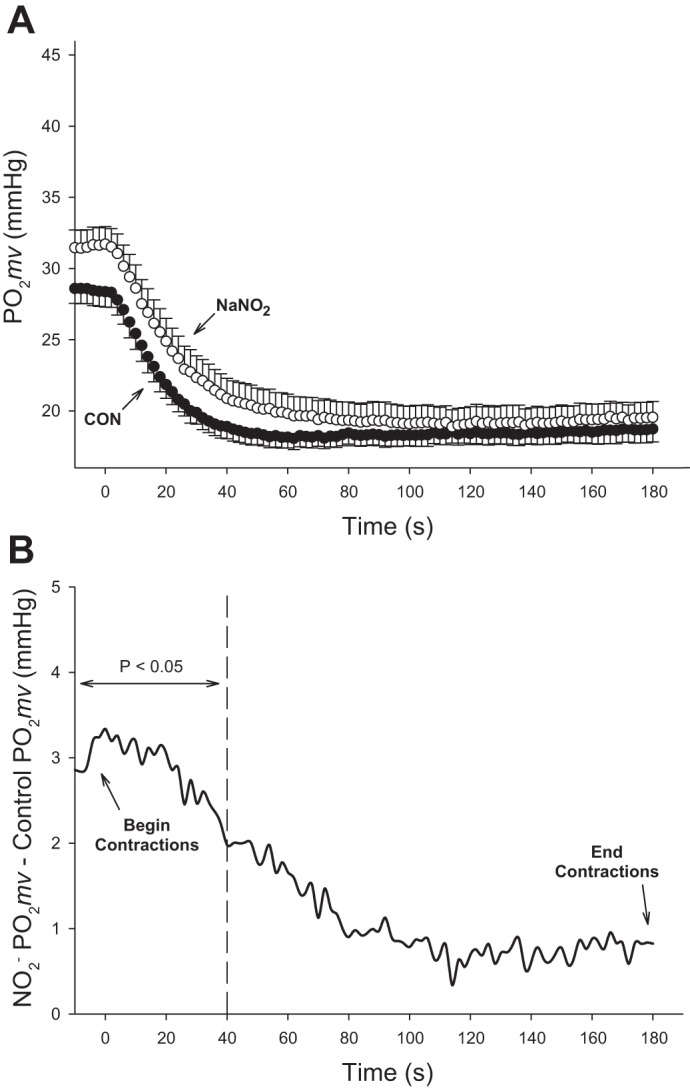
Fig. 4.

A: average spinotrapezius Po2mv kinetics for the second experimental group of rats (n = 12) during 180 s electrically stimulated contractions in the control condition (closed circles) and following NaNO2 superfusion (open circles). Mean arterial pressure was recorded at the beginning (105 ± 5 mmHg) and end (105 ± 5 mmHg) of the contraction protocol. Data are presented as means ± SE. B: Po2mv differences for each 2 s measurement for the experimental group of rats (n = 12) between NaNO2 and CON conditions during spinotrapezius muscle contractions. Note that before (i.e., left of) the dashed line, NaNO2 is significantly different from CON (P < 0.05).
