The maximum standardized uptake values and the Prostate Imaging Reporting and Data System version 2 scores of primary tumors at fluorine 18 fluorocholine PET/MR imaging show good correlation with clinical-pathologic characteristics, such as postsurgical Cancer of the Prostate Risk Assessment scores, which are related to prognosis in patients with newly diagnosed intermediate-to high-risk prostate cancer.
Abstract
Purpose
To investigate the initial clinical value of fluorine 18 (18F) fluorocholine (FCH) dynamic positron emission tomography (PET)/magnetic resonance (MR) imaging by comparing its parameters with clinical-pathologic findings in patients with newly diagnosed intermediate- to high-risk prostate cancer (PCa) who plan to undergo radical prostatectomy.
Materials and Methods
The institutional review board approved the study protocol, and informed written consent was obtained from all subjects for this HIPAA–compliant study. Twelve men (mean age ± standard deviation, 61.7 years ± 8.4; range, 46–74 years) with untreated intermediate- to high-risk PCa characterized according to Cancer of the Prostate Risk Assessment (CAPRA) underwent preoperative FCH dynamic PET/MR imaging followed by radical prostatectomy between April and November 2015. PET/MR imaging parameters including average and maximum K1 (delivery rate constant) and standardized uptake values (SUVs) and Prostate Imaging Reporting and Data System (PI-RADS) version 2 scores were measured and compared with clinical-pathologic characteristics. For statistical analysis, the Spearman rank correlation and Mann-Whitney U tests were performed.
Results
Of the PET parameters, maximum SUV of primary tumors showed significant correlations with several clinical-pathologic parameters including serum prostate-specific antigen level (ρ = 0.71, P = .01), pathologic stage (ρ = 0.59, P = .043), and postsurgical CAPRA score (ρ = 0.72, P = .008). The overall PI-RADS score showed significant correlations with pathologic tumor volume (ρ = 0.81, P < .001), percentage of tumor cells with Gleason scores greater than 3 (ρ = 0.59, P = .02), and postsurgical CAPRA score (ρ = 0.58, P = .046). The high-risk postsurgical CAPRA score patient group had a significantly higher maximum SUV than did the intermediate-risk group. Combined PET and MR imaging showed improved sensitivity (88%) for prediction of pathologic extraprostatic extension compared with that with MR imaging (50%) and PET (75%) performed separately.
Conclusion
Maximum SUVs and PI-RADS scores from FCH PET/MR imaging show good correlation with clinical-pathologic characteristics, such as postsurgical CAPRA score, which are related to prognosis in patients with newly diagnosed intermediate- to high-risk PCa.
© RSNA, 2016
Introduction
Prostate cancer (PCa) is one of the most common cancers and a major cause of morbidity and mortality in men (1). Currently, conventional imaging modalities such as endorectal ultrasonography, computed tomography (CT), and magnetic resonance (MR) imaging are used routinely for evaluation of PCa. However, accuracy for primary diagnosis and staging with these imaging modalities is limited (2,3).
Positron emission tomography (PET) and multiparametric MR imaging are emerging modalities with increasing utility for evaluation of PCa. PET is a noninvasive imaging method to evaluate metabolic or functional activity in vivo. Although fluorine 18 (18F) fluorodeoxyglucose PET is widely used in patients with various types of cancer with good results, it allows limited sensitivity for evaluation of PCa (4). There are promising results with carbon 11 (11C) and 18F fluorocholine (FCH) PET for evaluating PCa (3,4), which reflect increased choline transport and overexpression of choline kinase in cancer cells including PCa (5,6). FCH is more suitable for a routine clinical examination because of its longer half-life and the ease of its production for multiple doses prepared from a single batch. Multiparametric MR imaging of the prostate typically consists of T1- and T2-weighted, diffusion-weighted, and dynamic contrast material–enhanced sequences performed by using a gadolinium-based contrast agent (2,7). In patients with PCa, multiparametric MR imaging appears to be superior to conventional T1- and T2-weighted MR imaging sequences for characterization of the primary tumor and staging (2,7,8).
After PET/CT, several kinds of integrated PET/MR imaging systems were developed (9). With its excellent soft-tissue contrast, complimentary multiparametric information of MR imaging, and reduced ionizing radiation, PET/MR imaging has the potential to improve the diagnosis and initial staging of various kinds of cancers when compared with PET/CT (10). In patients with PCa, the fusion of 11C choline PET and multiparametric MR imaging showed better identification and localization of clinically important primary tumors than did the use of either 11C choline PET or multiparametric MR imaging alone (11). Similar results were reported in recent integrated PET/MR imaging studies (12–14) without the use of a time-of-flight capability with FCH.
Although there were several studies of the kinetics of FCH, the clinical importance of kinetic FCH PET parameters has not been evaluated well in patients with primary PCa, and to our knowledge, there are no studies to date in which an integrated PET/MR imaging system is used (15–17). Therefore, we investigated the initial clinical value of FCH-integrated dynamic PET/MR imaging by comparing its parameters with clinical-pathologic findings in patients with newly diagnosed intermediate- to high-risk PCa who planned to undergo radical prostatectomy.
Materials and Methods
This study was financially supported in part by GE Healthcare and the National Cancer Institute grant R01 CA148708. The authors had full control of the data, and the study was scientifically initiated by the authors, not by the industry.
Subjects
Our institutional review board approved the study protocol, and informed written consent was obtained from all subjects for this Health Insurance Portability and Accountability Act–compliant study. This study was performed as a part of a prospective clinical trial regarding choline PET/MR imaging for PCa (NCT#02397408). Subjects were men with untreated biopsy-proven PCa who were prospectively enrolled in this study from April to November 2015. Inclusion criteria were as follows: (a) biopsy-proven PCa with an intermediate to high risk or recurrence or death characterized according to a Cancer of the Prostate Risk Assessment (CAPRA) score greater than or equal to 3 (18,19), (b) at least one tumor with an estimated volume of greater than or equal to 1.0 cm3, and (c) plans to undergo radical prostatectomy with bilateral pelvic lymph node dissection within 1 month after FCH PET and multiparametric MR imaging.
FCH PET/Multiparametric MR Imaging Protocol
After at least 4 hours of fasting, 3 MBq/kg of FCH (mean ± standard deviation, 237 MBq ± 44; range, 155–307 MBq) was administered intravenously. Immediately after the injection, simultaneous PET/MR imaging of the pelvis was performed with an integrated imager (SIGNA PET/MR; GE Healthcare, Waukesha, Wis) with 3-T MR imaging and PET detectors and silicon photomultipliers as photodetectors.
Dynamic PET data were acquired for 30 minutes in list mode, covering a 25-cm axial field of view. For attenuation correction, a four-class and continuous fat and water method was used (20). PET images were then reconstructed into dynamic multiframes (6 × 10 sec, 8 × 30 sec, 5 × 1 min, and 4 × 5 min) with a matrix size of 128 × 128 (voxel size, 2.34 × 2.34 × 2.78 mm; transaxial field of view, 30 cm). A three-dimensional time-of-flight–enabled ordered subsets expectation maximization iterative algorithm including a point-spread function kernel (28 subsets, two iterations, and a postreconstruction Gaussian filter of 5-mm full-width at half-maximum) was applied. The standardized uptake values (SUVs) were calculated and adjusted by means of an injected dose according to tissue activity concentration and patient body weight.
For multiparametric MR imaging, an axial three-dimensional T1-weighted sequence, an axial three-dimensional T2-weighted sequence, an axial T1-weighted Dixon-type water and fat-separation sequence, an axial diffusion-weighted imaging (b = 0, 600 sec/mm2) sequence, an axial diffusion-weighted imaging (b = 0, 1350 sec/mm2) sequence, and a pre-gadolinium and dynamic contrast-enhanced MR imaging sequence with differential subsampling and cartesian ordering (21) were performed by using an endorectal coil (MedRad;Bayer Healthcare, Whippany, NJ) in conjunction with external coil arrays. For dynamic contrast-enhanced MR imaging, gadobutrol (0.1 mL/kg) or gadopentetate dimeglumine (0.2 mL/kg) was administered intravenously, followed by a 30-frame dynamic acquisition for 5 minutes with a differential subsampling with cartesian ordering sequence. The MR imaging pulse sequence details are shown in Table E1 (online).
PET/MR Image Analysis
Visual analyses of PET/MR imaging were performed independently, PET by a nuclear medicine physician (J.Y.C., with 15 years of experience) and MR imaging by a radiologist (S.B., with 9 years of experience), blinded to clinical-pathologic characteristics except the pathologic tumor location. The visual interpretation of multiparametric MR imaging was based on the Prostate Imaging Reporting and Data System (PI-RADS), version 2 (22). Lesions with low signal intensity on T2-weighted images and restricted diffusion on diffusion-weighted images were considered primary PCa matched with the pathologic tumor location. The presence of definite extraprostatic extension (EPE) was determined on the basis of T2-weighted and diffusion-weighted imaging. To measure PET parameters of primary tumors, a volume of interest in the primary tumor was manually drawn on the apparent diffusion coefficient map (b values = 1, 350, and 0 sec/mm2), where the lesion was most clearly identified on the T2-weighted and diffusion-weighted images. When the T2-weighted and diffusion-weighted imaging did not allow localization of the tumor (PI-RADS score < 3), a spherical volume of interest with a 1-cm diameter was placed over the area of highest focal FCH uptake on the 25–30–minute postinjection image, which was used for measuring PET parameters (n = 3). The maximum and average SUVs (SUVmax, SUVavg) of the primary tumors were measured on the 25–30–minute postinjection images. For the kinetic analysis, an imaging-derived plasma input function was estimated from manually drawn volumes of interest (3 × 3 × 1 voxels) of the bilateral internal iliac arteries on an early PET image in which the peak blood pool activity was the highest. We did not perform any partial volume corrections for the imaging-derived plasma input function. For the tracer kinetic modeling, the reversible one-tissue compartment model with blood volume parameter (one-tissue compartment model), the irreversible two-tissue compartment model with a blood volume parameter (two-tissue compartment model), and the Patlak graphical analysis were applied, which have been described previously (16,17,23). The last nine time points from 5 minutes to 30 minutes on the postinjection images were used to determine the slope by means of linear regression in the Patlak graphical analysis (23). As representative kinetic parameters reflecting FCH influx, the average and maximum K1 in the one-tissue compartment model and the Ki (net influx rate of the second compartment) in the two-tissue compartment model were calculated (15–17). To select the model for clinical-pathologic comparisons, the percentage of the standard error of measurement of the kinetic parameter reflecting the fitness of adjusted time-activity curves was calculated. For the PET/MR image analyses, commercial software packages (Advantage Workstation; GE Healthcare; PMOD version 3.4; PMOD Technologies; Zürich, Switzerland) were used.
Clinical-Pathologic Evaluation
Age and most recent total serum prostate specific antigen level (in nanograms per milliliter) before surgery were the clinical parameters recorded for the comparisons with PET/MR imaging. Pathologic parameters for the comparisons included the percentage of biopsy cores involved with cancer, Gleason score at surgery, TNM stage, EPE, tumor volume (in cubic centimeters), and estimated percentage of tumor cells with Gleason scores greater than 3 as evaluated by a pathologist. On the basis of imaging and clinical-pathologic findings, postsurgical CAPRA scores were determined (18,19).
Statistical Analysis
To compare the percentage of the standard errors of kinetic parameters from the kinetic models, the Wilcoxon test was used. To correlate PET/MR imaging parameters and clinical-pathologic characteristics, a Spearman rank correlation test was performed. To measure the predictability of EPE according to PET parameters including K1 and SUV, a receiver operating characteristic curve analysis was performed. The PET parameter that showed the highest area under curve was used for combination with multiparametric MR imaging results to assess whether the combination improved the predictability of EPE. To compare measures between patients at intermediate and high risk, a Mann-Whitney U test was performed. In the three patients in whom two primary tumors were identified, the tumor with EPE (n = 2) or a higher Gleason score (n = 1) was selected as the representative tumor for comparison with patient-representative parameters such as age, serum prostate-specific antigen level, stage, and postsurgical CAPRA score. A P value less than .05 was considered to indicate a statistically significant difference. Data were expressed as means ± standard deviation. A commercial program was used for all statistical analysis (MedCalc Version 15; MedCalc Software, Mariakerke, Belgium).
Results
Patient Characteristics
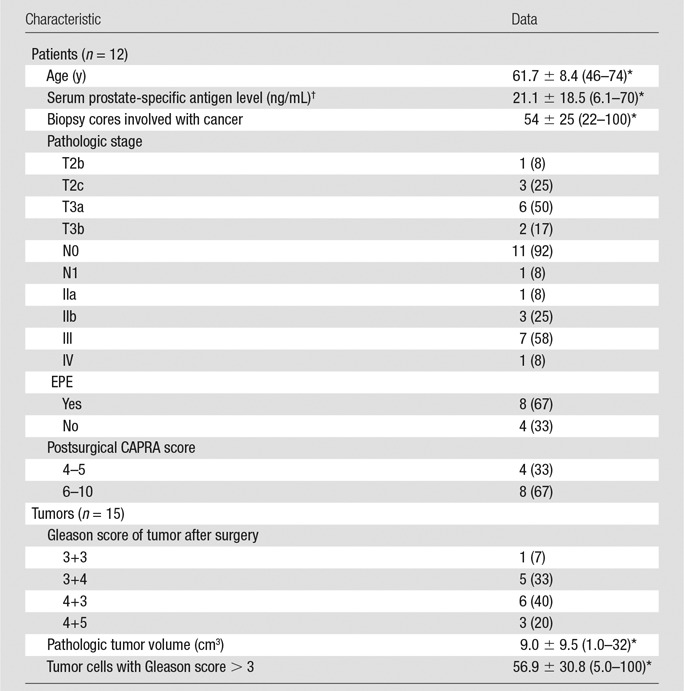
Fifteen patients in whom FCH dynamic PET/MR imaging was performed met the inclusion criteria. Among them, three patients were excluded from further analysis: one declined surgery, another underwent surgery more than 6 months after PET/MR imaging, and the dynamic acquisition was unsuccessful in the remaining patient. Therefore, a total of 12 men (mean age, 61.6 years ± 8.4; range, 46–74 years) were finally included in this study. After surgery, three patients had two primary tumors with a pathologic volume greater than or equal to 1 cm3 each. The final study comprised 15 primary tumors in 12 patients. The patients’ clinical-pathologic characteristics are shown in Table 1.
Table 1.
Clinical-Pathologic Characteristics of Patients and Tumors
Note.—Unless otherwise indicated, data are number of patients or tumors, with percentage in parentheses.
*Data are means ± standard deviation, with the range in parentheses.
†To convert to Systéme International units (micrograms per liter), multiply by 1.
Selection of a Kinetic Model
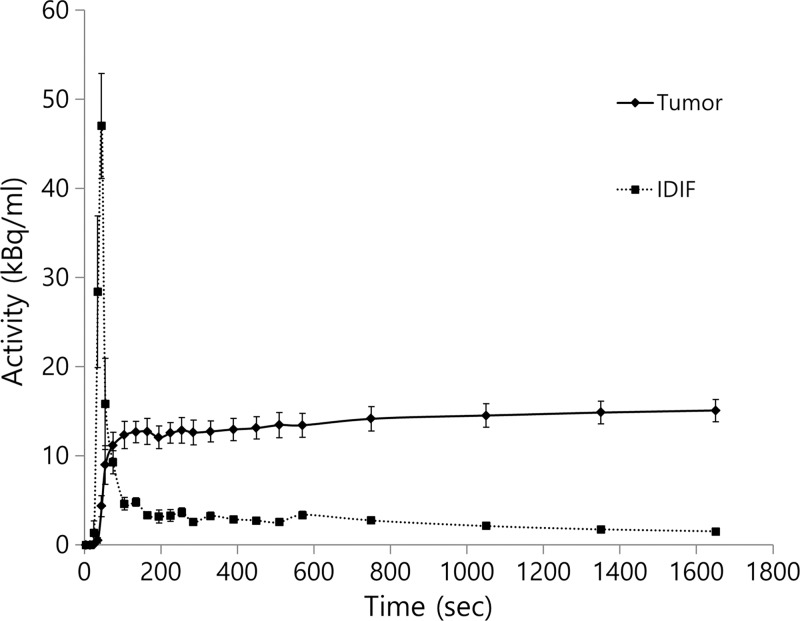
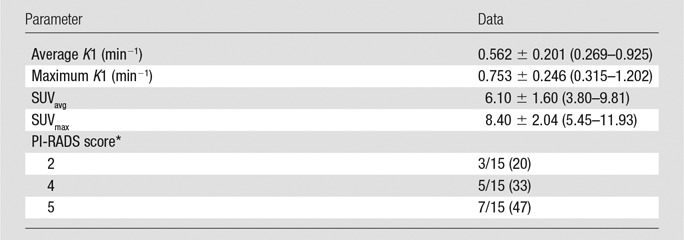
The estimated average K1 value according to the one-tissue component model was 0.562 min−1 ± 0.201 (range, 0.269–0.925; percentage of the standard error, 6.37% ± 1.65%). The estimated average net influx rate value according to the two-tissue component model and the Patlak graphical analysis were 0.128 min−1 ± 0.85 (range, 1.560 × 10⁻²⁷ to 0.265; percentage of the standard error, 4.89 × 1026% ± 1.40 × 1027%) and 0.161 min−1± 0.074 (range, 0.053–0.338; percentage of the standard error, 15.2% ± 12.4%), respectively. The percentage of the standard error from the one-tissue component model was significantly lower than that of the two-tissue component (P < .001) model or that of the Patlak graphical analysis (P = .0215). Therefore, the kinetic parameter from the one-tissue component model was adopted for further analysis. The averaged time-activity curves of primary tumors and imaging-derived plasma input functions are shown in Figure 1.
Figure 1:
Graph shows time-activity curves of primary tumors and image-derived input function (IDIF, mean ± standard error).
Comparisons in PET/MR Imaging Parameters
A representative case of PET/MR images is shown in Figure 2. The average K1 of primary tumors showed significant correlations with maximum K1 (ρ = 0.86, P < .001) and with SUVavg (ρ = 0.76, P = .001). The maximum K1 of primary tumors showed significant correlations with SUVmax (ρ = 0.65, P = .008) and with SUVavg (ρ = 0.60, P = .019). There was a significant correlation between SUVmax (ρ = 0.65, P = .008) and SUVavg of primary tumors (ρ = 0.63, P = .013). There were no significant correlations between PET parameters and MR imaging PI-RADS scores. Table 2 shows the summary of PET/MR imaging parameters from the 15 primary tumors.
Figure 2a:
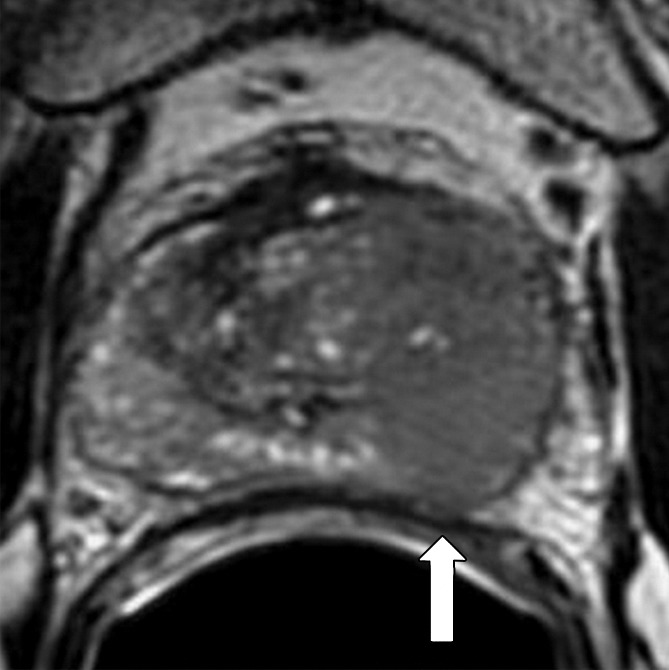
Transaxial integrated dynamic PET/MR images in a 46-year-old man with left PCa (Gleason score, 4+3 = 7; pathologic stage III). (a) T2-weighted image shows areas of low signal intensity, with an EPE involving posterior capsule (arrow, PI-RADS version 2 score of 5) and (b) apparent diffusion coefficient map, and (c) high FCH uptake on fused T2-weighted/PET SUV image (SUVavg, 6.75; SUVmax, 8.80) and (d) K1 parametric map (average K1 value, 0.475 min−1; maximum K1, 0.500 min−1) in tumor. Surgical pathologic examination showed tumor involvement in left posterior capsule.
Table 2.
PET/MR Imaging Parameters of Primary Tumors
Note.—Unless otherwise indicated, data are means ± standard deviation, with the range in parentheses.
*PI-RADS version 2. Data are proportions of tumors, with percentages in parentheses.
Figure 2b:
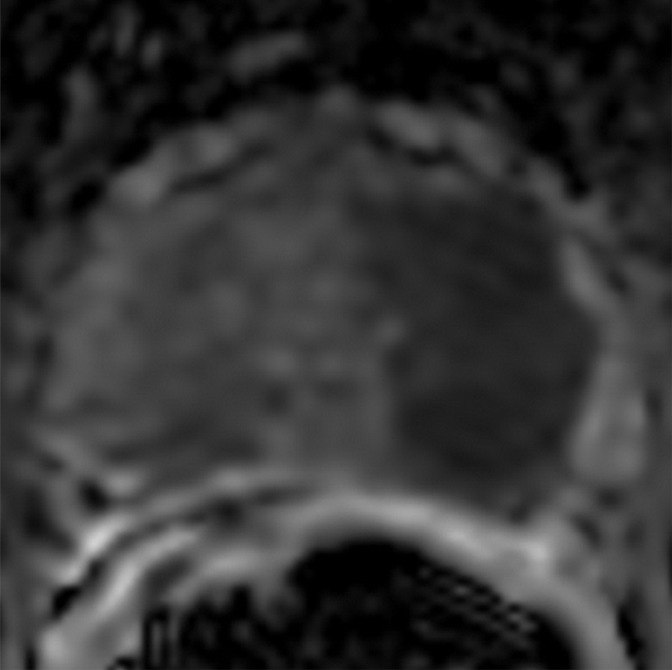
Transaxial integrated dynamic PET/MR images in a 46-year-old man with left PCa (Gleason score, 4+3 = 7; pathologic stage III). (a) T2-weighted image shows areas of low signal intensity, with an EPE involving posterior capsule (arrow, PI-RADS version 2 score of 5) and (b) apparent diffusion coefficient map, and (c) high FCH uptake on fused T2-weighted/PET SUV image (SUVavg, 6.75; SUVmax, 8.80) and (d) K1 parametric map (average K1 value, 0.475 min−1; maximum K1, 0.500 min−1) in tumor. Surgical pathologic examination showed tumor involvement in left posterior capsule.
Figure 2c:
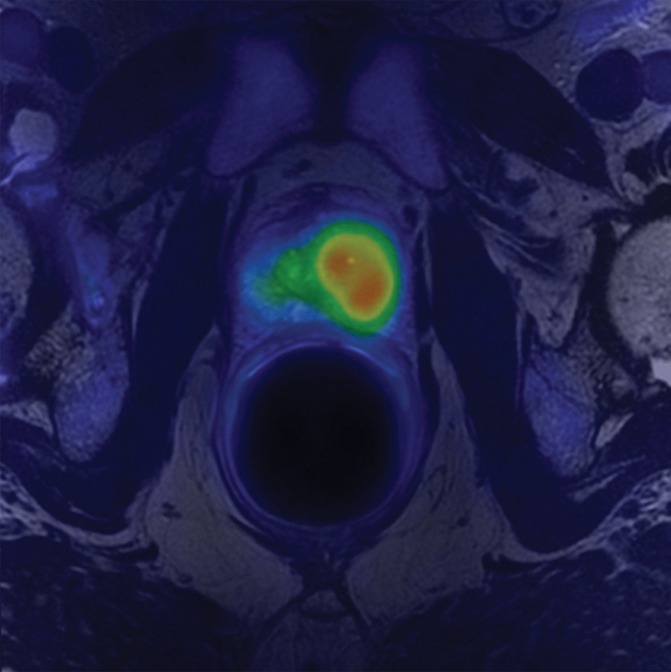
Transaxial integrated dynamic PET/MR images in a 46-year-old man with left PCa (Gleason score, 4+3 = 7; pathologic stage III). (a) T2-weighted image shows areas of low signal intensity, with an EPE involving posterior capsule (arrow, PI-RADS version 2 score of 5) and (b) apparent diffusion coefficient map, and (c) high FCH uptake on fused T2-weighted/PET SUV image (SUVavg, 6.75; SUVmax, 8.80) and (d) K1 parametric map (average K1 value, 0.475 min−1; maximum K1, 0.500 min−1) in tumor. Surgical pathologic examination showed tumor involvement in left posterior capsule.
Figure 2d:
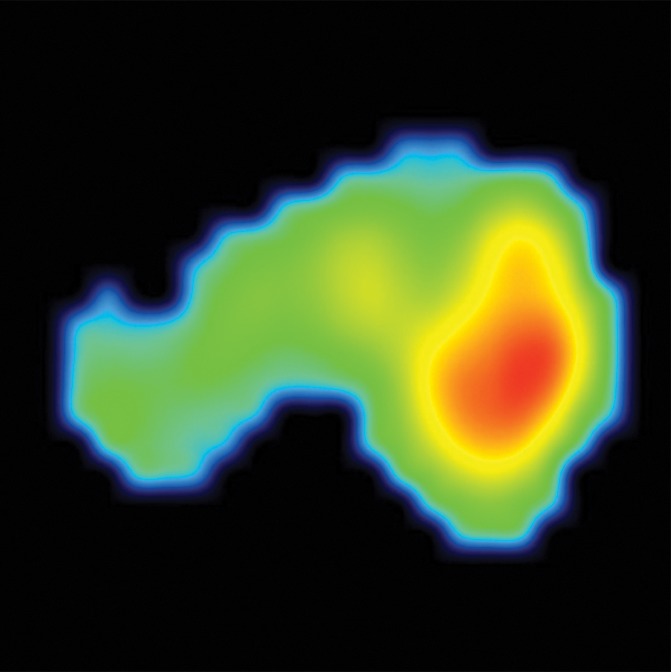
Transaxial integrated dynamic PET/MR images in a 46-year-old man with left PCa (Gleason score, 4+3 = 7; pathologic stage III). (a) T2-weighted image shows areas of low signal intensity, with an EPE involving posterior capsule (arrow, PI-RADS version 2 score of 5) and (b) apparent diffusion coefficient map, and (c) high FCH uptake on fused T2-weighted/PET SUV image (SUVavg, 6.75; SUVmax, 8.80) and (d) K1 parametric map (average K1 value, 0.475 min−1; maximum K1, 0.500 min−1) in tumor. Surgical pathologic examination showed tumor involvement in left posterior capsule.
Comparisons between PET/MR Imaging Parameters and Clinical-Pathologic Characteristics
PET/MR imaging parameters of all 15 primary tumors were compared with tumor-specific parameters such as Gleason score. There were no significant associations of PET parameters with clinical-pathologic characteristics except SUVmax of primary tumors. SUVmax showed significant positive correlations with serum prostate-specific antigen level (ρ = 0.71, P = .01), pathologic stage (ρ = 0.59, P = .043), and postsurgical CAPRA score (ρ = 0.72, P = .008). The PI-RADS score showed significant correlations with age (ρ = −0.62, P = .033), pathologic tumor volume (ρ = 0.81, P < .001), percentage of tumor cells with Gleason scores greater than 3 (ρ = 0.59, P = .02), and postsurgical CAPRA score (ρ = 0.58, P = .046). The results of all correlation analyses between PET/MR imaging parameters and clinical-pathological characteristics are shown in Table E2 (online).
The sensitivity and specificity of visually interpreted multiparametric MR imaging based on PI-RADS to identify EPE was 50% (4 of 8) and 100% (4 of 4), respectively. The receiver operating characteristic areas under the curve of PET parameters to predict EPE were 0.53 ± 0.22 for average K1, 0.56 ± 0.20 for maximum K1, 0.63 ± 0.19 for SUVavg, and 0.81 ± 0.14 for SUVmax. The SUVmax of the primary tumor showed sensitivity of 75% (six of eight) and specificity of 100% (four of four) with the use of retrospectively determined optimal cutoff 8.5 with the highest accuracy to predict the presence of EPE. When positive multiparametric MR imaging or SUVmax greater than 8.5 was considered positive for EPE prediction, PET/MR imaging showed improved sensitivity of 88% (seven of eight) without a change in specificity of 100% (shown in Figure 3).
Figure 3a:
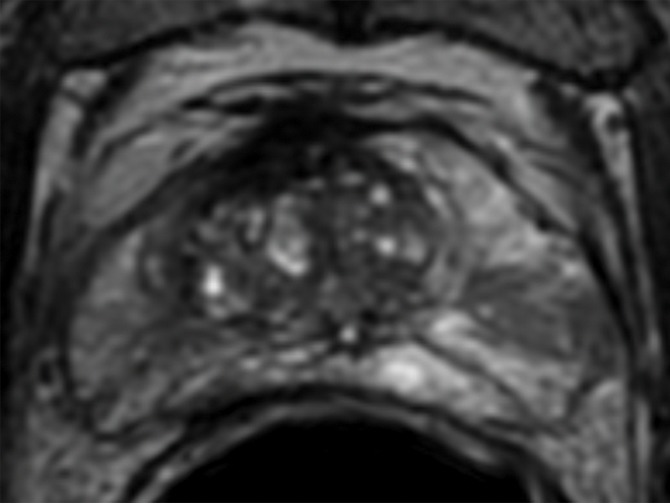
Transaxial PET/MR images in a 58-year-old man with left PCa (Gleason score, 4+3 = 7; pathologic stage III; pathologic EPE involving left posterolateral capsule) show (a) a low–signal-intensity tumor on T2-weighted image with an EPE (PI-RADS score, 5), but (b) T2-weighted PET fused image only shows moderate focal FCH uptake of SUVmax of 7.20 (<8.5). PET/MR transaxial images in a 60-year-old man with left PCa (Gleason score, 4+3 = 7; pathologic stage III; pathologic EPE involving left posterolateral capsule) show (c) a low–signal-intensity tumor on T2-weighted image without a definite EPE (PI-RADS score, 4), but (d) high focal FCH uptake of SUVmax of 9.6 (>8.5) on T2-weighted PET fused image.
Figure 3b:
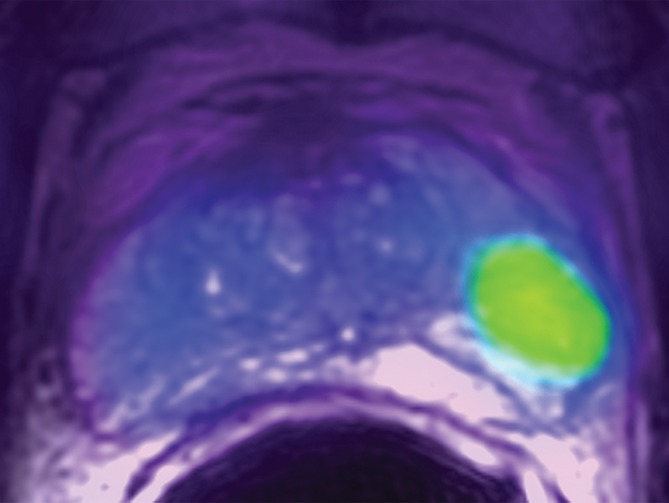
Transaxial PET/MR images in a 58-year-old man with left PCa (Gleason score, 4+3 = 7; pathologic stage III; pathologic EPE involving left posterolateral capsule) show (a) a low–signal-intensity tumor on T2-weighted image with an EPE (PI-RADS score, 5), but (b) T2-weighted PET fused image only shows moderate focal FCH uptake of SUVmax of 7.20 (<8.5). PET/MR transaxial images in a 60-year-old man with left PCa (Gleason score, 4+3 = 7; pathologic stage III; pathologic EPE involving left posterolateral capsule) show (c) a low–signal-intensity tumor on T2-weighted image without a definite EPE (PI-RADS score, 4), but (d) high focal FCH uptake of SUVmax of 9.6 (>8.5) on T2-weighted PET fused image.
Figure 3c:
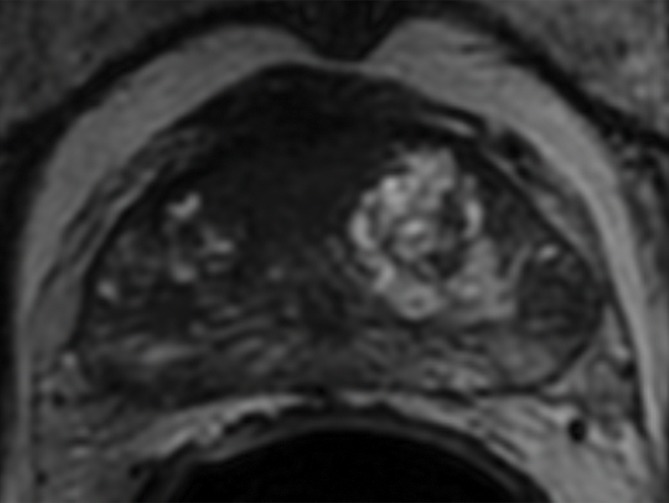
Transaxial PET/MR images in a 58-year-old man with left PCa (Gleason score, 4+3 = 7; pathologic stage III; pathologic EPE involving left posterolateral capsule) show (a) a low–signal-intensity tumor on T2-weighted image with an EPE (PI-RADS score, 5), but (b) T2-weighted PET fused image only shows moderate focal FCH uptake of SUVmax of 7.20 (<8.5). PET/MR transaxial images in a 60-year-old man with left PCa (Gleason score, 4+3 = 7; pathologic stage III; pathologic EPE involving left posterolateral capsule) show (c) a low–signal-intensity tumor on T2-weighted image without a definite EPE (PI-RADS score, 4), but (d) high focal FCH uptake of SUVmax of 9.6 (>8.5) on T2-weighted PET fused image.
Figure 3d:
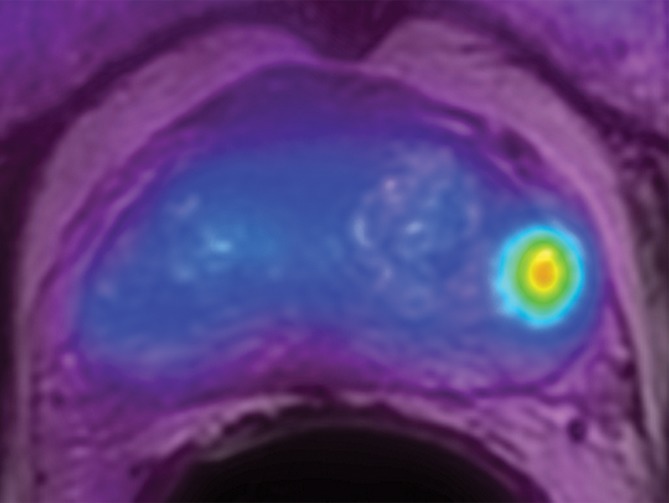
Transaxial PET/MR images in a 58-year-old man with left PCa (Gleason score, 4+3 = 7; pathologic stage III; pathologic EPE involving left posterolateral capsule) show (a) a low–signal-intensity tumor on T2-weighted image with an EPE (PI-RADS score, 5), but (b) T2-weighted PET fused image only shows moderate focal FCH uptake of SUVmax of 7.20 (<8.5). PET/MR transaxial images in a 60-year-old man with left PCa (Gleason score, 4+3 = 7; pathologic stage III; pathologic EPE involving left posterolateral capsule) show (c) a low–signal-intensity tumor on T2-weighted image without a definite EPE (PI-RADS score, 4), but (d) high focal FCH uptake of SUVmax of 9.6 (>8.5) on T2-weighted PET fused image.
Table 3 shows the PET/MR imaging parameters in postsurgical intermediate and postsurgical high-risk CAPRA score patient groups. There were significant differences in SUVmax of primary tumors between the two groups; the high-risk CAPRA score patient group had a higher SUVmax than did the intermediate risk group.
Table 3.
PET/MR Imaging Parameters According to the Postsurgical CAPRA Risk Score Group

Note.—Unless otherwise indicated, data are means ± standard deviation.
*PI-RADS version 2
Discussion
In this study, we investigated the potential clinical utility of kinetic parameters from FCH-integrated dynamic PET/MR imaging in patients with newly diagnosed intermediate- to high-risk PCa. Although both average and maximum K1 values from a kinetic analysis showed some correlation with SUVavg and/or SUVmax, there were no significant correlations between kinetic PET parameters and multiparametric MR imaging PI-RADS score and clinical-pathologic characteristics. On the contrary, SUVmaxand PI-RADS score showed good individual correlations with several clinical-pathologic characteristics such as age, pathologic tumor volume, percentage of tumor cells with Gleason scores greater than stage 3, or postsurgical CAPRA risk score. This suggests that kinetic FCH PET parameters may provide different information from other PET/MR imaging parameters and clinical-pathologic characteristics.
Although kinetic modeling by means of dynamic PET has an advantage to provide absolute quantitative values, it requires additional or lengthy dynamic imaging and is difficult to perform in a routine clinical setting. In a simultaneous PET/MR imaging device, a dynamic PET scan can be obtained without additional time during the focused, organ-specific MR imaging examination. In traditional kinetic modeling, a plasma-derived input function usually is obtained from arterial or arterialized venous sampling with a metabolite correction, which is relatively invasive and complex to perform in a routine clinical setting. On the contrary, obtaining an imaging-derived plasma input function is simple and noninvasive, and it can be performed in a clinical setting. Authors of a recent FCH PET study (17) reported that use of an imaging-derived plasma input function was feasible for a kinetic analysis, although it allowed overestimation of whole blood activities at later time points. In this study, among three kinds of kinetic models, the 1T2k+VB model was selected for clinical-pathologic comparisons of kinetic parameters because its goodness of fit to estimate the parameters was the best. Authors of a previous study (17) also suggested that this model was suitable for FCH kinetic modeling due to its robustness and consistency in shorter examinations, which can be applied to PET/MR imaging.
Both average and maximum K1 did not show significant correlations with other PET/MR imaging parameters and clinical-pathologic characteristics except the moderate correlations with static PET parameters. A moderate correlation between kinetic parameters and static parameters such as SUVs in FCH PET was previously reported (R < 0.58) (17). This means that kinetic parameters may provide different metabolic information from that of static PET parameters. In our study, however, there were no significant correlations between kinetic PET parameters and clinical-pathologic characteristics. Therefore, no clear clinical utility was found for these parameters on the basis of our preliminary results. However, the value of dynamic FCH data must be investigated further.
The SUVmax, a conventional static PET parameter, showed good correlation with serum prostate-specific antigen level, pathologic stage, and postsurgical CAPRA score. As far as we know, ours may be the first study in which PET parameters were compared with PI-RADS scores, the current standard of multiparametric MR imaging interpretation for diagnosis of PCa. There were no significant correlations between all PET and multiparametric MR imaging parameters, which is plausible, considering that FCH uptake is biologically different information from that obtained with multiparametric MR imaging. Our study showed good correlation between SUVmax and serum prostate-specific antigen levels, although there are contraversial results in a previous study (14,24) related to that correlation. The heterogeneity of study populations may contribute to such disparate results.
The CAPRA score is one of the most validated risk assessment systems for PCa (18,19). In patients who underwent surgery, the postsurgical CAPRA score reflected the prognosis better than did the presurgical score because of the inclusion of additional and accurate pathologic information (25,26). In our study, SUVmax and PI-RADS scores showed good correlations with the postsurgical CAPRA scores. Specifically, SUVmax demonstrated the highest correlation with the postsurgical CAPRA score, and the highest area under the receiver operating characteristic curve for prediction of EPE, a clinically important prognostic factor (27). Also, it is possible that the combination of SUVmax and PI-RADS will improve risk assessment of individual patients with PCa. The improved prediction of EPE with the combination of SUVmax and PI-RADS score and the lack of correlation between SUVmax and PI-RADS score support this possibility. Furthermore, single-voxel PET/MR imaging parameters such as SUVmax are not affected by the determination of the tumor volume of interest, and thereby provide a more robust and convenient measurement.
This study had several limitations. First, the small number of subjects and lack of clinical patient outcome follow-up were the main limitations. Therefore our work was hypothesis generating; further confirmatory studies are required. Second, an imaging-derived plasma input function was used for the kinetic modeling instead of a conventional plasma-derived input function. Third, for prediction of EPE, the SUVmax threshold was determined retrospectively on the basis of the test data set with a small number of patients. Further study with a larger sample-size validation set is necessary.
In conclusion, the SUVmax and the PI-RADS version 2 score of the primary tumors from FCH PET/MR imaging showed good correlation with clinical-pathologic characteristics such as postsurgical CAPRA score related to prognosis in patients with newly diagnosed intermediate- to high-risk PCa. Further studies regarding the prognostic significance and EPE prediction of combined FCH PET/MR imaging parameters are warranted in patients with PCa.
Advances in Knowledge
■ The maximum standardized uptake value (SUV) of primary tumors at fluorine 18 fluorocholine (FCH) dynamic time-of-flight PET/MR imaging showed a significant correlation with the serum prostate-specific antigen level(ρ = 0.71, P = .01), pathologic stage (ρ = 0.59, P = .043), and postsurgical Cancer of the Prostate Risk Assessment (CAPRA) score (ρ = 0.72, P = .008) in patients with newly diagnosed intermediate- to high-risk prostate cancer.
■ Both maximum and average K1 values, which are kinetic parameters of primary tumors at dynamic PET, showed no significant correlation with clinical-pathologic characteristics (ρ = −0.46 to 0.40, P > .05).
■ Prostate Imaging Reporting and Data System scores showed significant correlation with pathologic tumor volume (ρ = 0.81, P < .001), percentage of tumor cells with Gleason scores greater than 3 (ρ = 0.59, P = .02), and postsurgical CAPRA score (ρ = 0.58, P = .046).
■ Combined FCH PET/MR imaging showed an improved sensitivity of 88% (seven of eight) for prediction of pathologic extraprostatic extension compared with 50% (four of eight) for MR imaging and 75% (six of eight) for PET performed separately.
■ The high-risk postsurgical CAPRA score patient group had a significantly higher mean ± standard deviation maximum SUV than did the intermediate-risk group (9.53 ± 1.48 vs 6.24 ± 1.26, P < .008).
Implication for Patient Care
■ Good correlation of FCH PET/MR imaging parameters of primary tumors with clinical prognostic factors suggests that further studies should be performed with combined FCH PET/MR imaging parameters for evaluation of prognosis and prediction of extraprostatic extension in patients with a new diagnosis of intermediate- to high-risk prostate cancer.
SUPPLEMENTAL TABLES
Received January 27, 2016; revision requested March 23; revision received April 18; accepted May 24; final version accepted June 3.
Study supported by GE Healthcare. S.M.N. supported by the National Cancer Institute (R01 CA148708).
Disclosures of Conflicts of Interest: J.Y.C. disclosed no relevant relationships. J.Y. Activities related to the present article: GE Healthcare provided partial funding and the offline toolbox used. Activities not related to the present article: disclosed no relevant relationships. Other relationships: disclosed no relevant relationships. S.M.N. disclosed no relevant relationships. S.B. Activities related to the present article: consultant for GE Healthcare. Activities not related to the present article: disclosed no relevant relationships. Other relationships: grant from Navidea. A.J.C. disclosed no relevant relationships. J.P.S. disclosed no relevant relationships. H.G.N. disclosed no relevant relationships. P.R.C. disclosed no relevant relationships. J.K. Activities related to the present article: disclosed no relevant relationships. Activities not related to the present article: disclosed no relevant relationships. Other relationships: disclosed no relevant relationships. Y.S. disclosed no relevant relationships.
Abbreviations:
- CAPRA
- Cancer of the Prostate Risk Assessment
- EPE
- extraprostatic extension
- FCH
- fluorine 18 fluorocholine
- PCa
- prostate cancer
- PI-RADS
- Prostate Imaging Reporting and Data System
- SUV
- standardized uptake value
- SUVavg
- average SUV
- SUVmax
- maximum SUV
References
- 1.Zhou CK, Check DP, Lortet-Tieulent J, et al. Prostate cancer incidence in 43 populations worldwide: An analysis of time trends overall and by age group. Int J Cancer 2016;138(6):1388–1400. [DOI] [PMC free article] [PubMed] [Google Scholar]
- 2.Bjurlin MA, Rosenkrantz AB, Beltran LS, Raad RA, Taneja SS. Imaging and evaluation of patients with high-risk prostate cancer. Nat Rev Urol 2015;12(11):617–628. [DOI] [PubMed] [Google Scholar]
- 3.Mapelli P, Picchio M. Initial prostate cancer diagnosis and disease staging–the role of choline-PET-CT. Nat Rev Urol 2015;12(9):510–518. [DOI] [PubMed] [Google Scholar]
- 4.Kitajima K, Murphy RC, Nathan MA, Sugimura K. Update on positron emission tomography for imaging of prostate cancer. Int J Urol 2014;21(1):12–23. [DOI] [PubMed] [Google Scholar]
- 5.DeGrado TR, Baldwin SW, Wang S, et al. Synthesis and evaluation of (18)F-labeled choline analogs as oncologic PET tracers. J Nucl Med 2001;42(12):1805–1814. [PubMed] [Google Scholar]
- 6.Janardhan S, Srivani P, Sastry GN. Choline kinase: an important target for cancer. Curr Med Chem 2006;13(10):1169–1186. [DOI] [PubMed] [Google Scholar]
- 7.Kurhanewicz J, Vigneron D, Carroll P, Coakley F. Multiparametric magnetic resonance imaging in prostate cancer: present and future. Curr Opin Urol 2008;18(1):71–77. [DOI] [PMC free article] [PubMed] [Google Scholar]
- 8.Fütterer JJ, Briganti A, De Visschere P, et al. Can clinically significant prostate cancer be detected with multiparametric magnetic resonance imaging? A systematic review of the literature. Eur Urol 2015;68(6):1045–1053. [DOI] [PubMed] [Google Scholar]
- 9.Boellaard R, Quick HH. Current image acquisition options in PET/MR. Semin Nucl Med 2015;45(3):192–200. [DOI] [PubMed] [Google Scholar]
- 10.Fraum TJ, Fowler KJ, McConathy J. PET/MRI: Emerging clinical applications in oncology. Acad Radiol 2016;23(2):220–236. [DOI] [PubMed] [Google Scholar]
- 11.Park H, Wood D, Hussain H, et al. Introducing parametric fusion PET/MRI of primary prostate cancer. J Nucl Med 2012;53(4):546–551. [DOI] [PMC free article] [PubMed] [Google Scholar]
- 12.Wetter A, Lipponer C, Nensa F, et al. Simultaneous 18F choline positron emission tomography/magnetic resonance imaging of the prostate: initial results. Invest Radiol 2013;48(5):256–262. [DOI] [PubMed] [Google Scholar]
- 13.Wetter A, Nensa F, Schenck M, et al. Combined PET imaging and diffusion-weighted imaging of intermediate and high-risk primary prostate carcinomas with simultaneous [18F] choline PET/MRI. PLoS One 2014;9(7):e101571. [DOI] [PMC free article] [PubMed] [Google Scholar]
- 14.Kim YI, Cheon GJ, Paeng JC, et al. Usefulness of MRI-assisted metabolic volumetric parameters provided by simultaneous (18)F-fluorocholine PET/MRI for primary prostate cancer characterization. Eur J Nucl Med Mol Imaging 2015;42(8):1247–1256. [DOI] [PubMed] [Google Scholar]
- 15.DeGrado TR, Reiman RE, Price DT, Wang S, Coleman RE. Pharmacokinetics and radiation dosimetry of 18F-fluorocholine. J Nucl Med 2002;43(1):92–96. [PubMed] [Google Scholar]
- 16.Takesh M. Kinetic modeling application to (18)F-fluoroethylcholine positron emission tomography in patients with primary and recurrent prostate cancer using two-tissue compartmental model. World J Nucl Med 2013;12(3):101–110. [DOI] [PMC free article] [PubMed] [Google Scholar]
- 17.Verwer EE, Oprea-Lager DE, van den Eertwegh AJ, et al. Quantification of 18F-fluorocholine kinetics in patients with prostate cancer. J Nucl Med 2015;56(3):365–371. [DOI] [PubMed] [Google Scholar]
- 18.Cooperberg MR, Pasta DJ, Elkin EP, et al. The University of California, San Francisco Cancer of the Prostate Risk Assessment score: a straightforward and reliable preoperative predictor of disease recurrence after radical prostatectomy. J Urol 2005;173(6):1938–1942. [DOI] [PMC free article] [PubMed] [Google Scholar]
- 19.Cooperberg MR, Broering JM, Carroll PR. Risk assessment for prostate cancer metastasis and mortality at the time of diagnosis. J Natl Cancer Inst 2009;101(12):878–887. [DOI] [PMC free article] [PubMed] [Google Scholar]
- 20.Wollenweber SD, Ambwani S, Lonn AH, et al. Comparison of 4-class and continuous fat/water methods for whole-body, MR-based PET attenuation correction. IEEE Trans Nucl Sci 2013;60(5):3391–3398. [Google Scholar]
- 21.Saranathan M, Rettmann DW, Hargreaves BA, Clarke SE, Vasanawala SS. DIfferential Subsampling with Cartesian Ordering (DISCO): a high spatio-temporal resolution Dixon imaging sequence for multiphasic contrast enhanced abdominal imaging. J Magn Reson Imaging 2012;35(6):1484–1492. [DOI] [PMC free article] [PubMed] [Google Scholar]
- 22.Weinreb JC, Barentsz JO, Choyke PL, et al. PI-RADS Prostate Imaging - Reporting and Data System: 2015, Version 2. Eur Urol 2016;69(1):16–40. [DOI] [PMC free article] [PubMed] [Google Scholar]
- 23.Sutinen E, Nurmi M, Roivainen A, et al. Kinetics of [(11)C]choline uptake in prostate cancer: a PET study. Eur J Nucl Med Mol Imaging 2004;31(3):317–324. [DOI] [PubMed] [Google Scholar]
- 24.Beheshti M, Imamovic L, Broinger G, et al. 18F choline PET/CT in the preoperative staging of prostate cancer in patients with intermediate or high risk of extracapsular disease: a prospective study of 130 patients. Radiology 2010;254(3):925–933. [DOI] [PubMed] [Google Scholar]
- 25.Seo WI, Kang PM, Kang DI, Yoon JH, Kim W, Chung JI. Cancer of the Prostate Risk Assessment (CAPRA) Preoperative Score Versus Postoperative Score (CAPRA-S): ability to predict cancer progression and decision-making regarding adjuvant therapy after radical prostatectomy. J Korean Med Sci 2014;29(9):1212–1216. [DOI] [PMC free article] [PubMed] [Google Scholar]
- 26.Tilki D, Mandel P, Schlomm T, et al. External validation of the CAPRA-S score to predict biochemical recurrence, metastasis and mortality after radical prostatectomy in a European cohort. J Urol 2015;193(6):1970–1975. [DOI] [PubMed] [Google Scholar]
- 27.Mikel Hubanks J, Boorjian SA, Frank I, et al. The presence of extracapsular extension is associated with an increased risk of death from prostate cancer after radical prostatectomy for patients with seminal vesicle invasion and negative lymph nodes. Urol Oncol 2014;32(1):26.e1–26.e7. [DOI] [PubMed] [Google Scholar]
Associated Data
This section collects any data citations, data availability statements, or supplementary materials included in this article.


