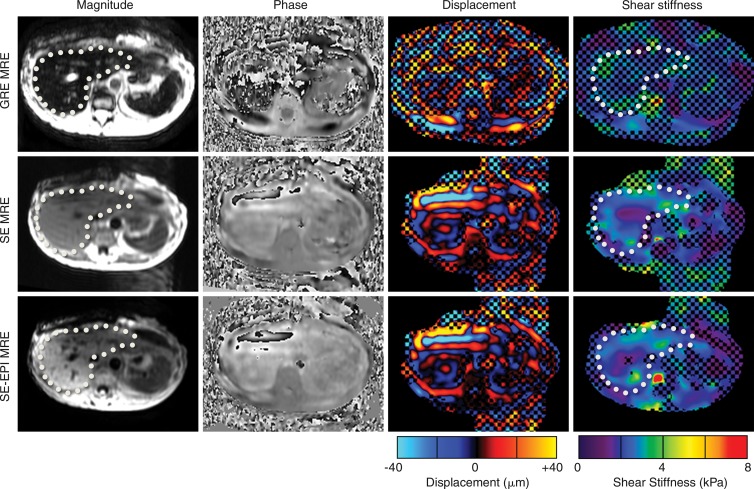
Figure 5:
MR elastographic (MRE) images in patient with low signal intensity at GRE MR elastography. Images were obtained with GRE MR elastography (top row), SE MR elastography (middle row), and SE-EPI MR elastography (bottom row). Liver is indicated with dotted line. For GRE MR elastography, signal intensity level in liver was low and resulted in noise-dominated phase images and a stiffness map fully masked out because of low inversion confidence. Conversely, both SE sequences had significantly improved SNR and confidence level, with waves clearly visualized on phase-contrast images. Mean hepatic stiffness values were 2.3 kPa ± 0.83 for SE MR elastography and 2.4 kPa ± 0.77 for SE-EPI MR elastography; the GRE data were considered unusable.

