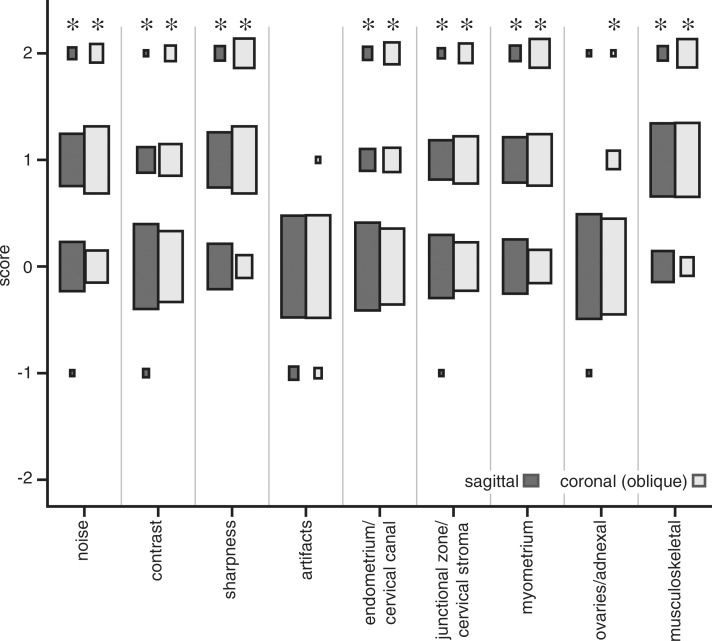
Figure 1b:
Comparison of conventional SSFSE and vrfSSFSE imaging. (a) Box and whisker plot for the comparison of repetition times is shown. The box denotes the 25th–75th percentile, the middle bar denotes the median, and the top and bottom bars demonstrate the range. For each pair (conventional SSFSE vs vrfSSFSE imaging), the differences were significant (P < .0001). (b) Results of semiquantitative grading for noise, image contrast, sharpness, artifacts, and perceived ability to evaluate endometrial, myometrial, adnexal, and musculoskeletal structures and pathologic abnormalities are shown. The area of each rectangle corresponds to the relative frequency of that response. Significant P values were all less than or equal to .003, as described in the text. The scoring system used is explained in Table 2. Negative numbers favor conventional SSFSE imaging, and positive numbers favor vrfSSFSE imaging. * = significant differences.

