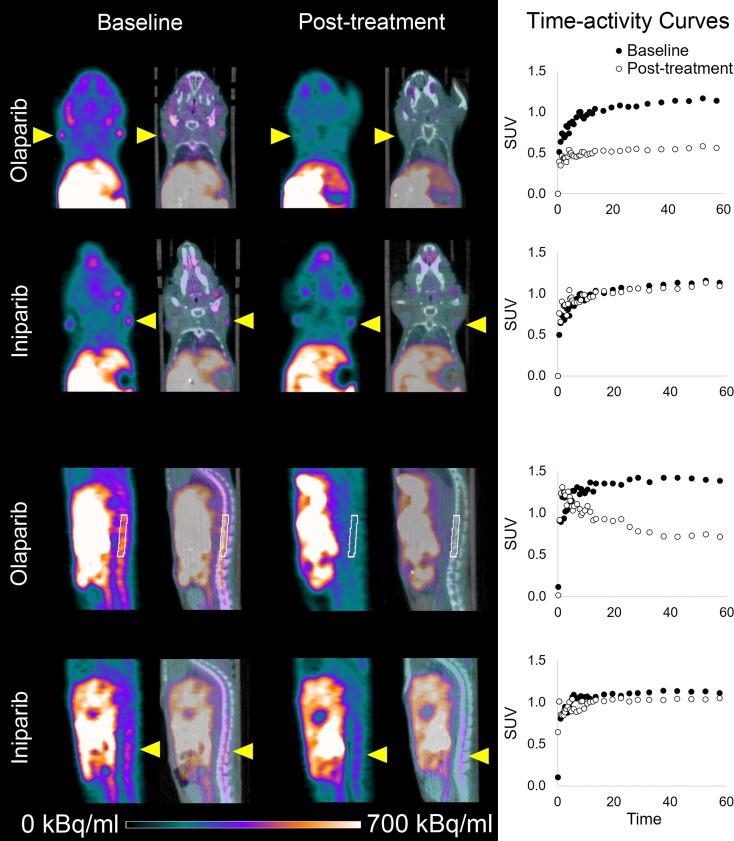
Figure 2:
18F-FTT micro-PET images of athymic nude mice demonstrate nodal and spine activity before and after treatment with olaparib or iniparib. Coronal and sagittal micro-PET (last 10 minutes of 60-minute acquisition) and CT images of normal mice with lymph nodes and spine uptake indicated by yellow arrowheads or white region of interest. Corresponding time-activity curves are also shown. Left and right lymph node standard uptake values (SUV) over time were averaged to create graphs of time-activity curves for lymph nodes.

