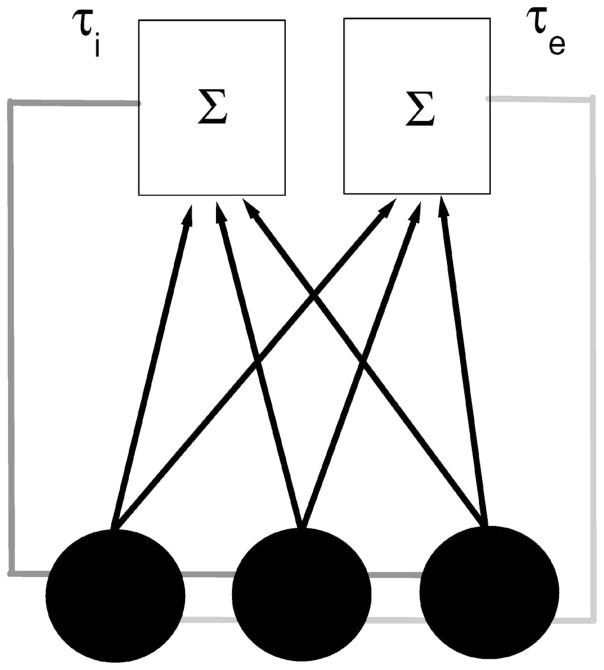
FIG. 1.
Circuit diagram of our model. Each neuron is represented by a circle and sends its output to two kernels (one excitatory, one inhibitory) that sum the outputs from the population. The kernels’ output is then sent back to the neural population with delays τe and τi (gray and light gray, respectively). This example is drawn for N=3 neurons.

