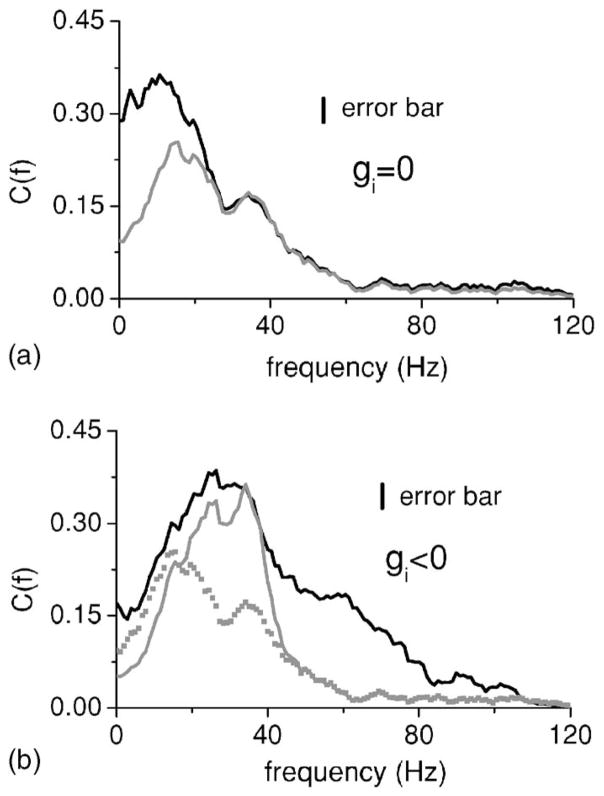
FIG. 10.
(a) Comparison between data (black) and the prediction from Eq. (15) (gray) with feedback blocked (i.e., gk=0). There is a good qualitative agreement between the two curves. (b) Comparison between data (black) and the prediction from Eq. (15) in the presence of feedback (gray). The prediction with no feedback is also shown for comparison (gray squares). Again, good qualitative agreement with the data is seen in that the coherence at low frequencies is reduced and that the coherence at high frequencies is increased (compare with Fig. 8). Note the quantitative agreement between the peak of the black and gray lines. Error bars are shown as a vertical line for the experimental data.

