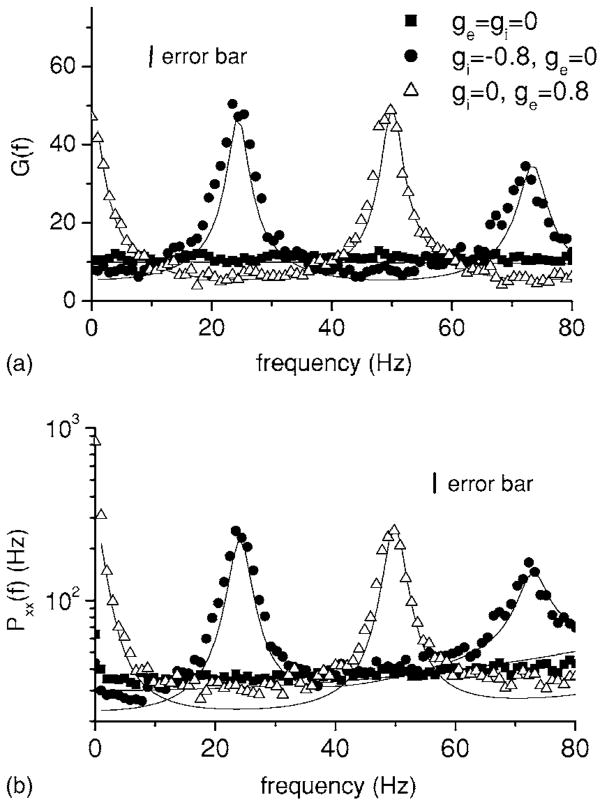
FIG. 3.
System gain G(f)=|H(f)| (a) and output spike train power spectrum (b) for one neuron in a network of 100 neurons as a function of frequency f for the same conditions as in Fig. 2. The solid curves are computed from Eqs. (14) and (13). Excitatory feedback (triangles) will tend to increase the response near f =0 and f =50 Hz while inhibitory feedback (circles) will tend to increase the response near f =25 Hz and f =75 Hz. Parameter values are the same as in Fig. 2. Error bars are shown for the simulation data.

