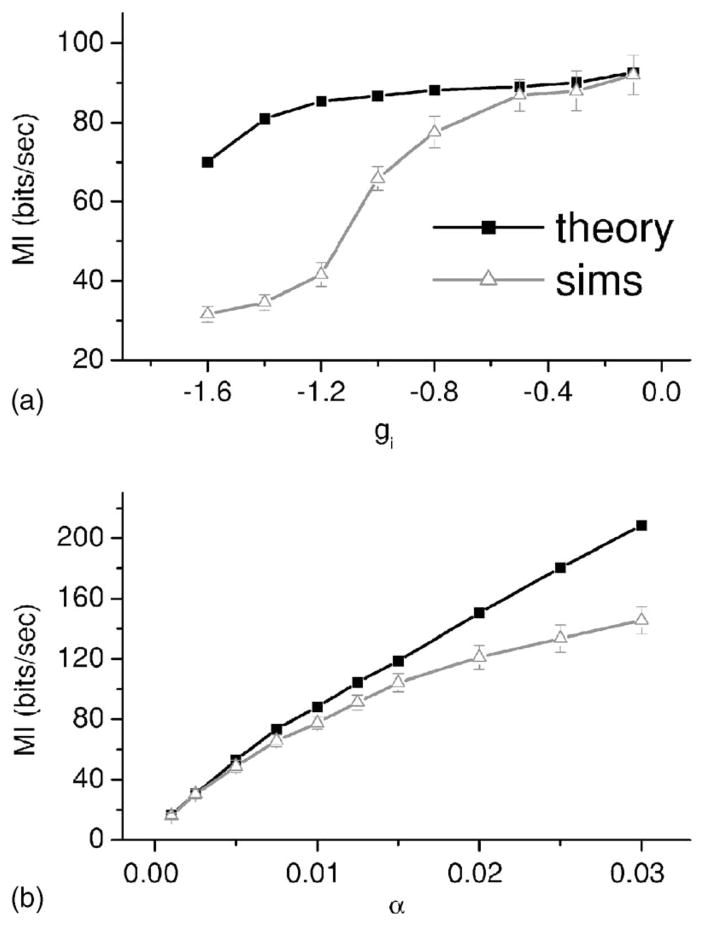
FIG. 7.
(a) Mutual information rate MI from numerical simulations (gray triangles) and from linear response theory (black squares) as a function of gain g(i). Other parameter values are the same as in Fig. 2 except N=20. (b) Mutual information rate MI from numerical simulations as a function of stimulus intensity α. Other parameter values are the same as in Fig. 2 except N=20. In both cases, deviations between numerical simulations and the theory are seen as nonlinearities increase due to feedback alone (a) and feedforward and feedback input (b). Error bars are shown on the simulation data.

