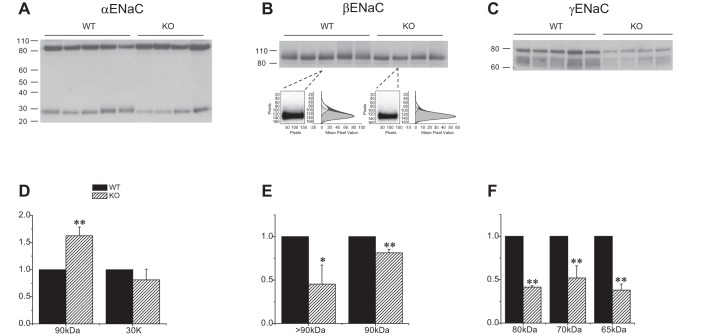
Fig. 4.
Expression of ENaC protein in Sgk1+/+ and Sgk1−/− mice fed a high-K diet. A–C: Western blots of kidney homogenates probed with antibodies against αENaC, βENaC, and γENaC. Lanes were loaded with 80 μg of total protein. In B, two lanes are enlarged to illustrate the presence of a diffuse, higher molecular mass material above the main band at 90 kDa, along with the densitometry traces used to quantitate their expression. D–F: quantitation of the blots in A–C. Data are represented as means ± SE for 4–5 animals in each group. *Significant difference compared with Sgk1+/+ with P < 0.05. **Significant difference compared with Sgk1+/+ with P < 0.01.

