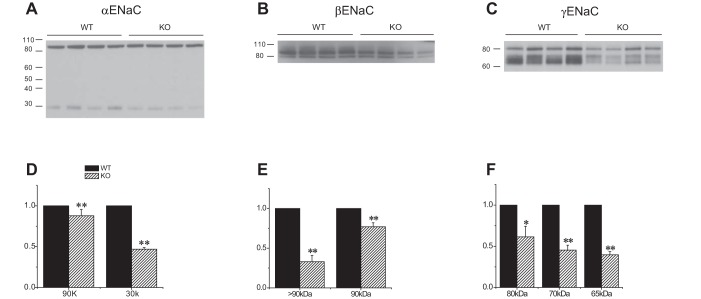
Fig. 5.
Expression of ENaC protein in Sgk1+/+ and Sgk1−/− mice treated with aldosterone. A–C: Western blots of kidney homogenates probed with antibodies against αENaC, βENaC, and γENaC. Lanes were loaded with 60 μg (αENaC), 75 μg (βENaC), or 45 μg (γENaC)of total protein. D–F: quantitation of the blots in A–C. Data are represented as means ± SE for 4 animals in each group. *Significant difference compared with Sgk1+/+ with P < 0.05. **Significant difference compared with Sgk1+/+ with P < 0.01.

