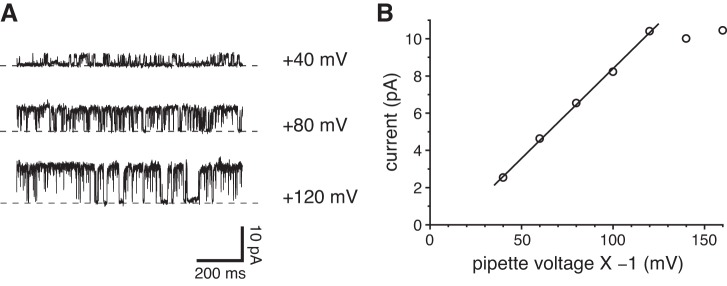
Fig. 2.
Single ciliary channel observed while cell attached. A: current fluctuations from opening and closing of a single channel at the potentials shown. The recording pipette contained a single cilium and was attached to the intact cell near the base of the cilium. The dashed lines indicate the current level when the channel was closed. The recordings were low-pass filtered at 1 kHz following acquisition. The standard external solution was used to bathe the cell and to fill the pipette. B: current-voltage relation for the single channel shown in A. The relation between +40 and +120 mV was fit to a straight line; the slope of that line (single-channel conductance) is 97 pS. Voltages in this figure only are reported as pipette potential × −1. This represents the contribution of the pipette potential to the membrane potential of the patched cilium. That membrane potential also includes the resting cell potential, which was not measured.

