Fig. 5.
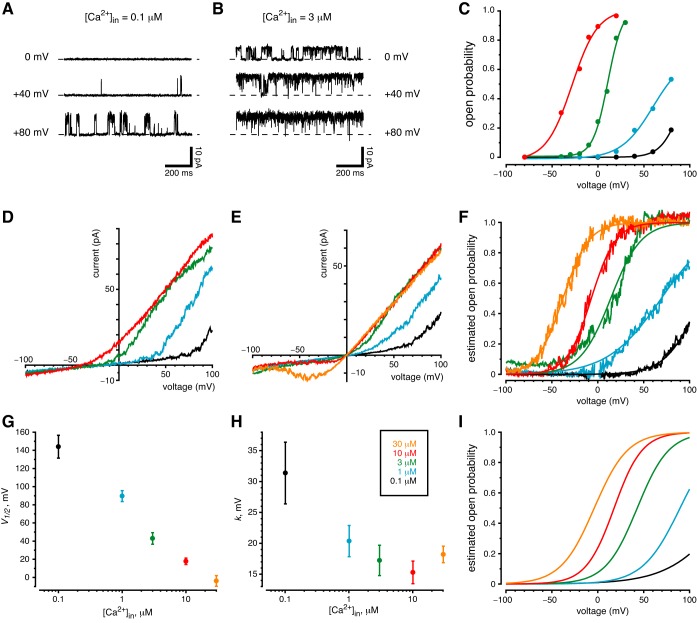
Channel sensitivity to membrane potential and cytoplasmic Ca2+. The color key shown in H applies to all of parts C–I. A–C: measurements from observing single channels. A: the activity of a single ciliary channel increased with membrane depolarization. The standard external solution was used to bathe the cell and to fill the pipette; the cytoplasmic solution was the standard solution, which contained 0.1 µM free Ca2+. B: channel activity at each voltage was increased after cytoplasmic free Ca2+ was increased to 3 µM. The same cilium was used for parts A and B. C: open probability as a function of membrane potential and the concentration of cytoplasmic Ca2+. Cytoplasmic Ca2+ was varied from 0.1 to 10 µM as indicated; the standard external solution was used. Open probabilities were determined from amplitude histograms made from 20-s recordings at each voltage and the Ca2+ concentration shown. All measurements in C are from a single cilium having 4 of the large-conductance channels. D–I: measurements from macroscopic currents. D: current-voltage relation in a cilium with several large-conductance channels. Solutions were as in C. Each record shown is the average of 20 ramps from −100 to +100 mV. E: the same protocol as D, but with high-K+ external and cytoplasmic solutions. Each record shown is the average of 40 ramps. This cilium had 4 large-conductance channels. F: estimated channel open probability as a function of membrane potential and the concentration of cytoplasmic Ca2+ from the recordings in E. Open probability was estimated and fit to a Boltzmann function as described in materials and methods. The Boltzmann functions are shown as smooth curves in F. G and H: mean values of the Boltzmann constants V1/2 and k, respectively, measured in 10 cilia as functions of cytoplasmic Ca2+ concentration. I: the Boltzmann functions resulting from the mean constants shown in G and H.

