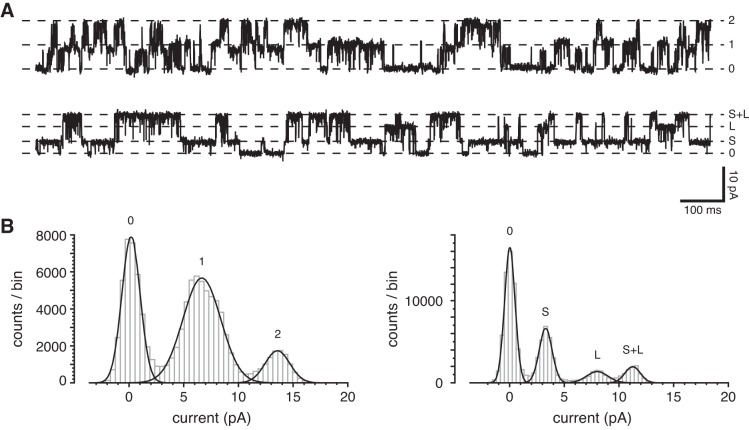
Fig. 7.
Change in channel conductance with time. A: the upper recording shows current fluctuations from opening and closing of two large-conductance channels in a cilium 6 min following excision from the cell. The lower recording shows the fluctuations in the same cilium 35 min following excision. The standard external solution was used to bathe the cell and to fill the pipette; the cytoplasmic solution contained 3 µM free Ca2+. Holding potential was +10 mV. B: amplitude histograms from the full 20-s recordings parts of which are shown in A. The left histogram (from the upper recording in A) shows peaks corresponding to two equivalent channels, each conducting 6.8 pA. The right histogram (lower recording), shows a smaller channel conducting 3.3 pA (S) and a larger channel conducting 8.0 pA (L). The third peak (S+L, 11.3 pA) represents simultaneous openings of each of the two channels.

