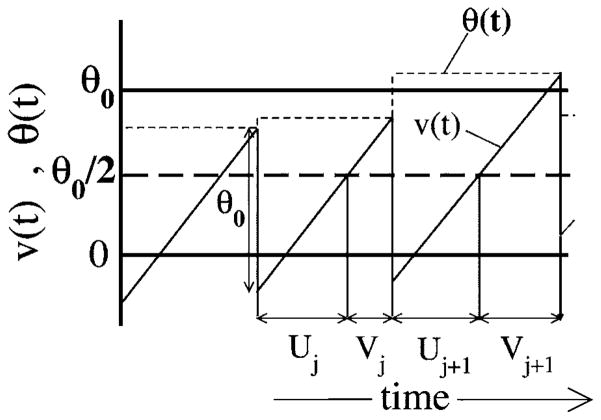
FIG. 1.
The spontaneous dynamics of model A, with voltage and threshold as functions of time. Shown are the voltage v(t) (solid line), which rises linearly with slope μ, as well as the threshold θ(t) (dashed line) for s(t)=0. When v(t)=θ(t), a spike is generated, and the voltage is decremented by θ0 while the threshold is reset to a uniform random value in the interval (θ0−D, θ0+D). Also shown are the ISIs Ij and Ij+1; note that Ij can be divided into the subintervals Uj and Vj such that Ij=Uj+Vj.

