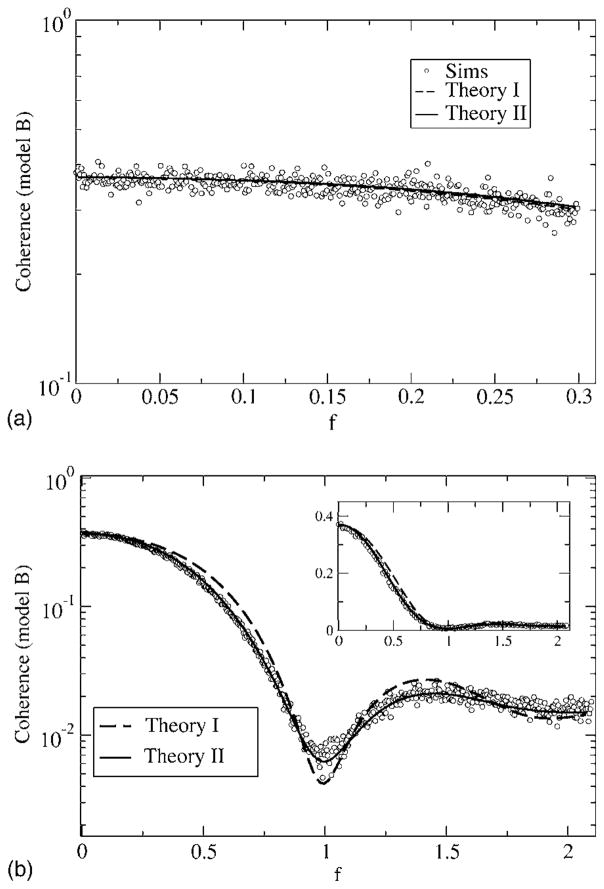
FIG. 16.
Coherence function for model B, with fL = 0 and fC = 0.3 (top) and fC = 2.1 (bottom). Other parameters are α = 0.015625, D = 0.2. Simulation results are for Nreal = 103 stochastic realizations of the spike train and stimulus, with a time step of Δt = 5 ×10⁻³; 2 ×10²¹ time steps were used. The coherences according to theory I and II are shown as a dashed and a solid line, respectively. The two theories do not differ much for fC = 0.3 but yield large differences for a high-cutoff frequency fC = 2.1, in particular, in the frequency band around the eigenfrequency of the neuron f ≈ 1. Again the difference in coherence between the two theories is not that large if looked at on a linear scale (inset, bottom).

