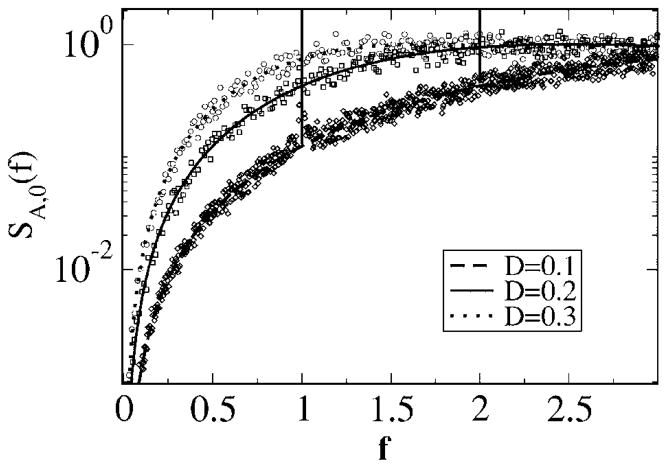
FIG. 4.
Power spectra of model A for different values of the noise intensity as indicated. The continuous part of Eq. (27) (smooth lines) is compared to numerical simulations (symbols). For the latter, we used a simple Euler procedure with time step Δt = 5 × 10⁻³. The power spectra were obtained by averaging over the Fourier transforms of 20 spike trains of length Tsim = 2621.44 (in arbitrary units). Parameter values for numerical simulations were θ0 = 1, μ= 1, and s(t) ≡ 0.

