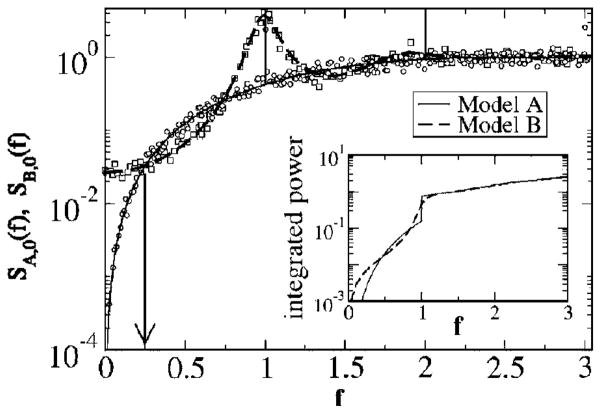
FIG. 6.
Comparison between power spectra of models A and B for D = 0.2. The arrow indicates the frequency at which both power spectra intersect for the first time. The inset shows the integrated power from zero up to the frequency f as a function of f. The convergence of the two lines demonstrates that the two spectra differ only in their shape but have equal total power.

