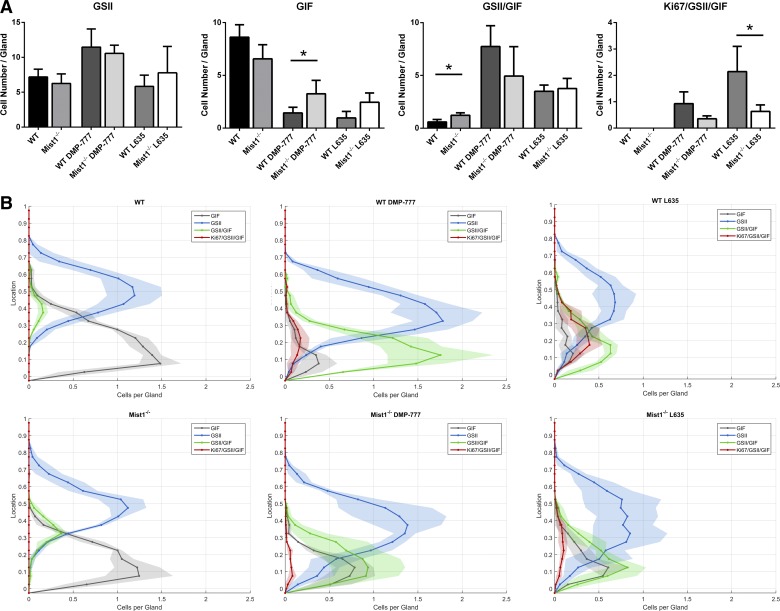
Fig. 4.
Quantitation and distribution of cell lineages in untreated and drug-treated wild-type mice and Mist1−/− mice. The total number (A) and localization (B) of specific immunolabeled cells were analyzed from immunolabeled glands (Ki67, GSII lectin, and GIF) from 3 mice in each group. A: the immunolabeling cell patterns was identified as follows: GSII lectin only (GSII), GIF only (GIF), GSII lectin, and GIF dual-labeled only (GSII+/GIF+), and triple-labeled cells (Ki67+/GSII+/GIF+). Upon DMP-777 treatment, more GIF only (chief cells) remained in Mist1−/− mice than in wild-type mice. No statistically significant difference in GSII+/GIF+ cells was found within each drug treatments. In contrast, while L635 treatment leads to an obvious increase in Ki67+/GSII+/GIF+ cells (proliferating SPEM cells) in wild-type mice; L635-treated Mist1−/− mice have significantly less proliferating SPEM cells (*P value = 0.05). B: the localization of each immunolabeling group from A is shown in distribution histograms with the y-axis representing the gastric gland divided into 10% increments (1 = lumen and 0 = base of gland) and x-axis depicting the number of cells per gland. This novel depiction of cell localization allows for visualization of the different cell labeling patterns observed in wild-type (top row) and Mist1−/− (bottom row) mice as well as cellular changes that occur upon drug treatment (untreated: left column; DMP-777: middle column; L635: right column). The histograms of Mist1−/− mice show the chief cells that resist transdifferentiation into SPEM are predominately localized to the bottom of the glands. GSII (blue), GIF (gray), GSII+/GIF+ (green), and Ki67+/GSII+/GIF+ (red).

