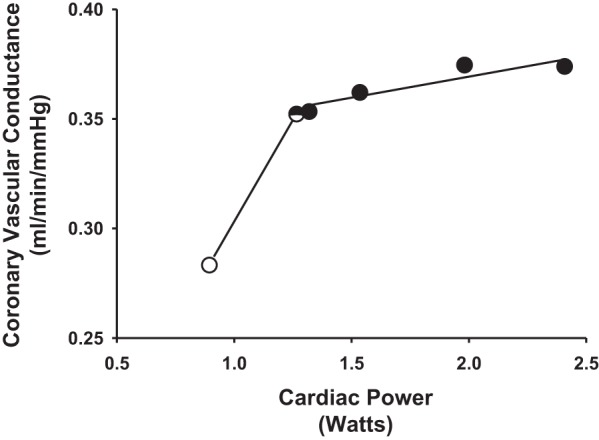
Fig. 6.

The relationship between CVC and CP in one animal during rest (open circle), free-flow exercise (half-filled circle), and all subsequent reductions in HLBF (filled circles). A straight line was ascribed from rest to free-flow exercise. Linear regression analysis was used fit a straight line through free-flow exercise and all subsequent reductions in HLBF. The relationship from rest to max was exceedingly nonlinear. Therefore, resting data were excluded and a straight line was ascribed to the remaining data points (i.e., free-flow exercise and all HLBF reductions) via linear regression analysis to appropriately compare the slopes of the relationship before and after induction of hypertension and with and without α1-adrenergic blockade (see Fig. 7).
