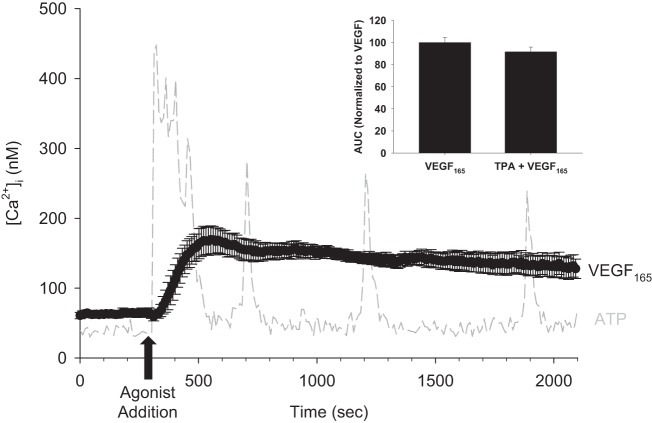
Fig. 1.
Mean Ca2+ response to 30 min of VEGF165 treatment in human umbilical vein endothelial cells (HUVEC). Fura-2-loaded HUVEC were placed on an inverted fluorescent microscope. After a 5-min baseline intracellular free Ca2+ concentration ([Ca2+]i) recording, cells were exposed to 10 ng/ml vascular endothelial growth factor (VEGF)165 for 30 min. The mean response ± SE is depicted in black over the duration of the experiment. For comparison, a typical 100 μM ATP-stimulated HUVEC [Ca2+]i recording is shown in gray. For VEGF165 treatment, n = 6 dishes. Inset: mean area under the curve (AUC) of 10 ng/ml VEGF165-stimulated Ca2+ responses with and without 10 nM TPA pretreatment for 30 min, normalized to VEGF165 alone (VEGF165, n = 5 dishes; TPA + VEGF165, n = 5 dishes; P = 0.221).

