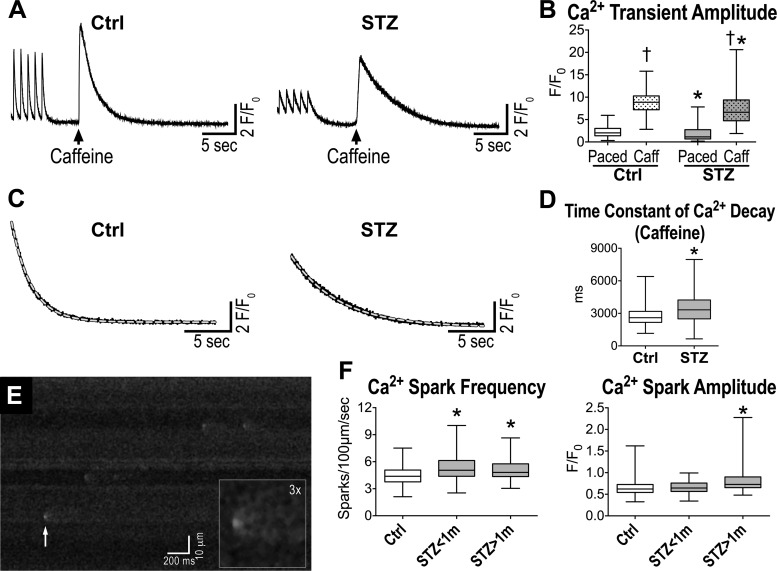
Fig. 7.
Diabetes alters intracellular Ca2+ handling. A: caffeine-induced Ca2+ transients for one myocyte obtained from a naïve C57Bl/6 female mouse (Ctrl; left) and one myocyte from a STZ-treated female C57Bl/6 mouse 77 days after induction of diabetes (right). B: quantitative data for Ca2+ transient amplitude induced by electrical stimulation (Paced) or caffeine spritz (Caff) for cardiomyocytes from naïve female C57Bl/6 mice (Ctrl, n = 257 cells from 6 animals) and STZ-treated female C57Bl/6 mice at 63–97 days after induction of diabetes (n = 216 cells from 5 animals) are shown as median and interquartile ranges. †P < 0.001 vs. Paced; *P < 0.001 vs. Ctrl in the same experimental condition. C: fitting with monoexponential functions (gray dashed lines) of the decay phase of caffeine-induced Ca2+ transients shown in A. The following parameters characterize the 2 functions: Ctrl, time constant = 2075 ms, R2 = 0.997; STZ, time constant = 4994 ms, R2 = 0.995. D: quantitative data for the decay of the caffeine-induce Ca2+ transient, which is reflective of Na+/Ca2+ exchanger activity for cardiomyocytes from naïve female C57Bl/6 mice (Ctrl, n = 181 cells from 6 animals) and STZ-treated female C57Bl/6 mice at 63–97 days after induction of diabetes (n = 133 cells from 5 animals) are shown as median and interquartile ranges. *P < 0.001 vs. Ctrl. E: line-scan image of a myocyte from a STZ-treated female C57Bl/6 mouse 15 days after induction of diabetes. White arrow points to a spontaneous Ca2+ release event, which is magnified in inset. F: quantitative data for the occurrence and amplitude of Ca2+ sparks in cardiomyocytes from naïve female C57Bl/6 mice (Ctrl, n = 101 cells from 4 animals) and STZ-treated female C57Bl/6 mice at 15–19 and 45–83 days after induction of diabetes (STZ < 1 m; n = 53 cells from 3 animals; STZ > 1 m; n = 80 cells from 5 animals) are shown as median and interquartile ranges. *P < 0.05 vs. Ctrl.

