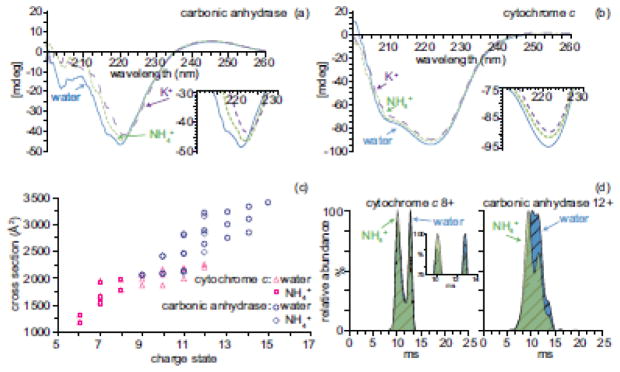
Figure 1.
(a) CD spectra of 10 μM carbonic anhydrase and (b) 10 μM cytochrome c in pure water (solid blue line), 10 mM ammonium acetate (green dotted line), and 10 mM potassium acetate (purple dashed line). (c) Collision cross sections of 10 μM cytochrome c ions (pink) and carbonic anhydrase ions (blue) and formed from 10 mM ammonium acetate (square, diamond, respectively) or pure water (triangle, circle, respectively) as a function of charge state. (d) Arrival time distributions of cytochrome c 8+ ions and carbonic anhydrase 12+ ions formed from water (blue) or 10 mM ammonium acetate (green)

