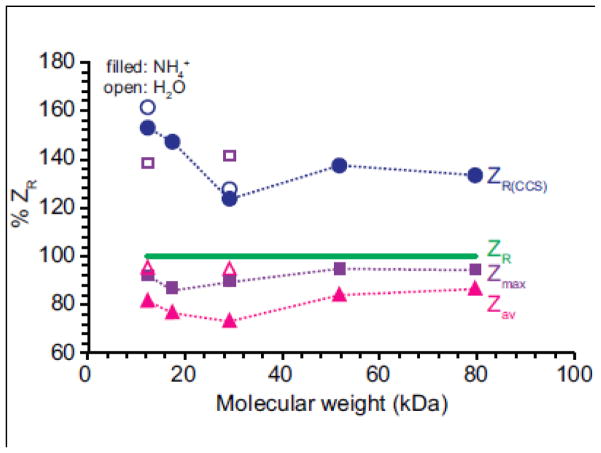
Figure 4.
Zmax (purple square), Zav (pink triangles), ZR(CCS) (blue circles) for protein ions formed from aqueous ammonium acetate (filled) or pure water (open) relative to ZR (green line) as a function of molecular weight. ZR represents the maximum number of charges on a protein predicted using the Rayleigh limit for a droplet the same size as a spherical protein with a density of 1.0 g/cm3. ZR(CCS) represents the maximum number of charges predicted using the Rayleigh limit for a spherical droplet with the same radius as the CCSav for the protein ions.

